Tag Archives: open data

Data Diaries: What I learned

As some of you might know I’ve recently moved back to the US and after taking a break, I wanted to share some of my thoughts on the past 7 years of Open Data in India. These are just some of the big lessons I’ve learned and observations that I think are important.

Data needs advocates from every sector

Historically the biggest voices that government hears about data are corporations selling products or statisticians being gatekeepers. Now that data is a part of everybody’s life in ways that are unseen, data literacy is necessary for everyone and data needs advocates from every walk of life. What I experienced with DataMeet was that broad data ideas with inputs from experts from all sectors can be very powerful. When you advocate for the data itself and how it needs to be accessible for everyone you can give solutions and perspectives that statisticians and for profit companies can’t. Ideas that are new because they are in the best interest of the whole.  That’s why we are invited to the table because even though it doesn’t make political or economic sense (yet) to listen to us, it is a different perspective that is helpful to know.

This is why every sector, education, environment, journalists, all actors have to integrate a data advocacy component to their work.  Issues of collection, management, and access affect your work and when you go to talk to governments about the issues you want to improve, creating better data and making it easier to get should automatically be apart of it. The idea of “I got the data I need so I’m good” does not make the next time you need data, or being upset with the quality of data  being used to create policy, easier to deal with.

Building ecosystems are more important than projects

In 2011 when I started to work on water data, it became clear that there was no techie/data ecosystem for non profits to tap into for advice and talent. There were individuals but no larger culture of tech/data for public good. This hadn’t been the case in the US so when I was at India Water Portal I wanted to spend time to find it because it’s really important for success. I was basically told by several people that it wasn’t possible in India. That people don’t really volunteer or share in the way the west does. It will be difficult to achieve.

With open data growing quickly into an international fad with lots of funding from places like Open Gov Partnership and Omidyar, I knew open data projects were going to happen. But they would be in silos and they would largely not be successful. Creating a culture that asks and demands for data and then has the means to use it is not something that is created from funded projects. It comes from connecting people who have the  same issues and demonstrating the demand.

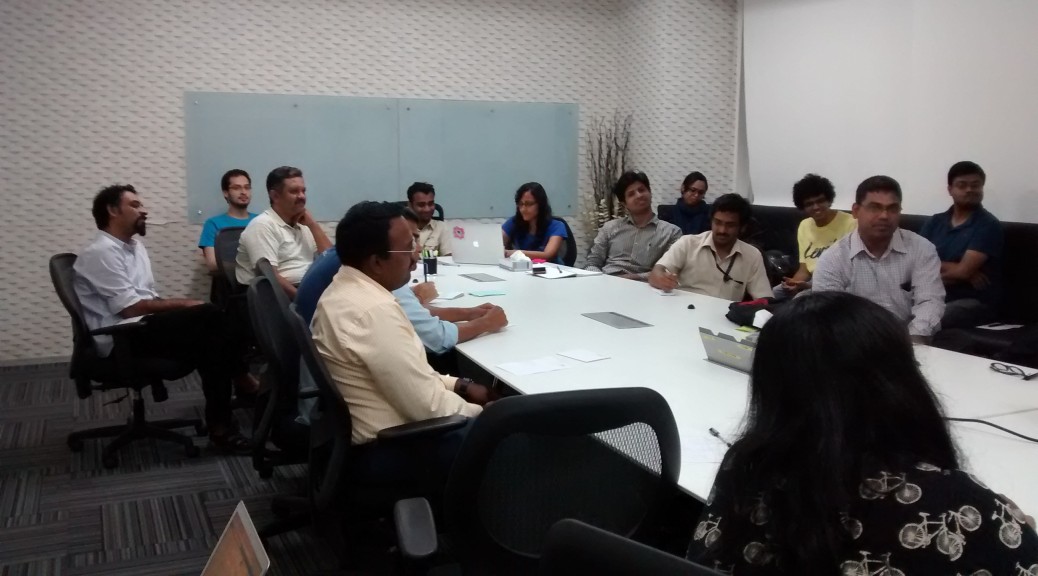
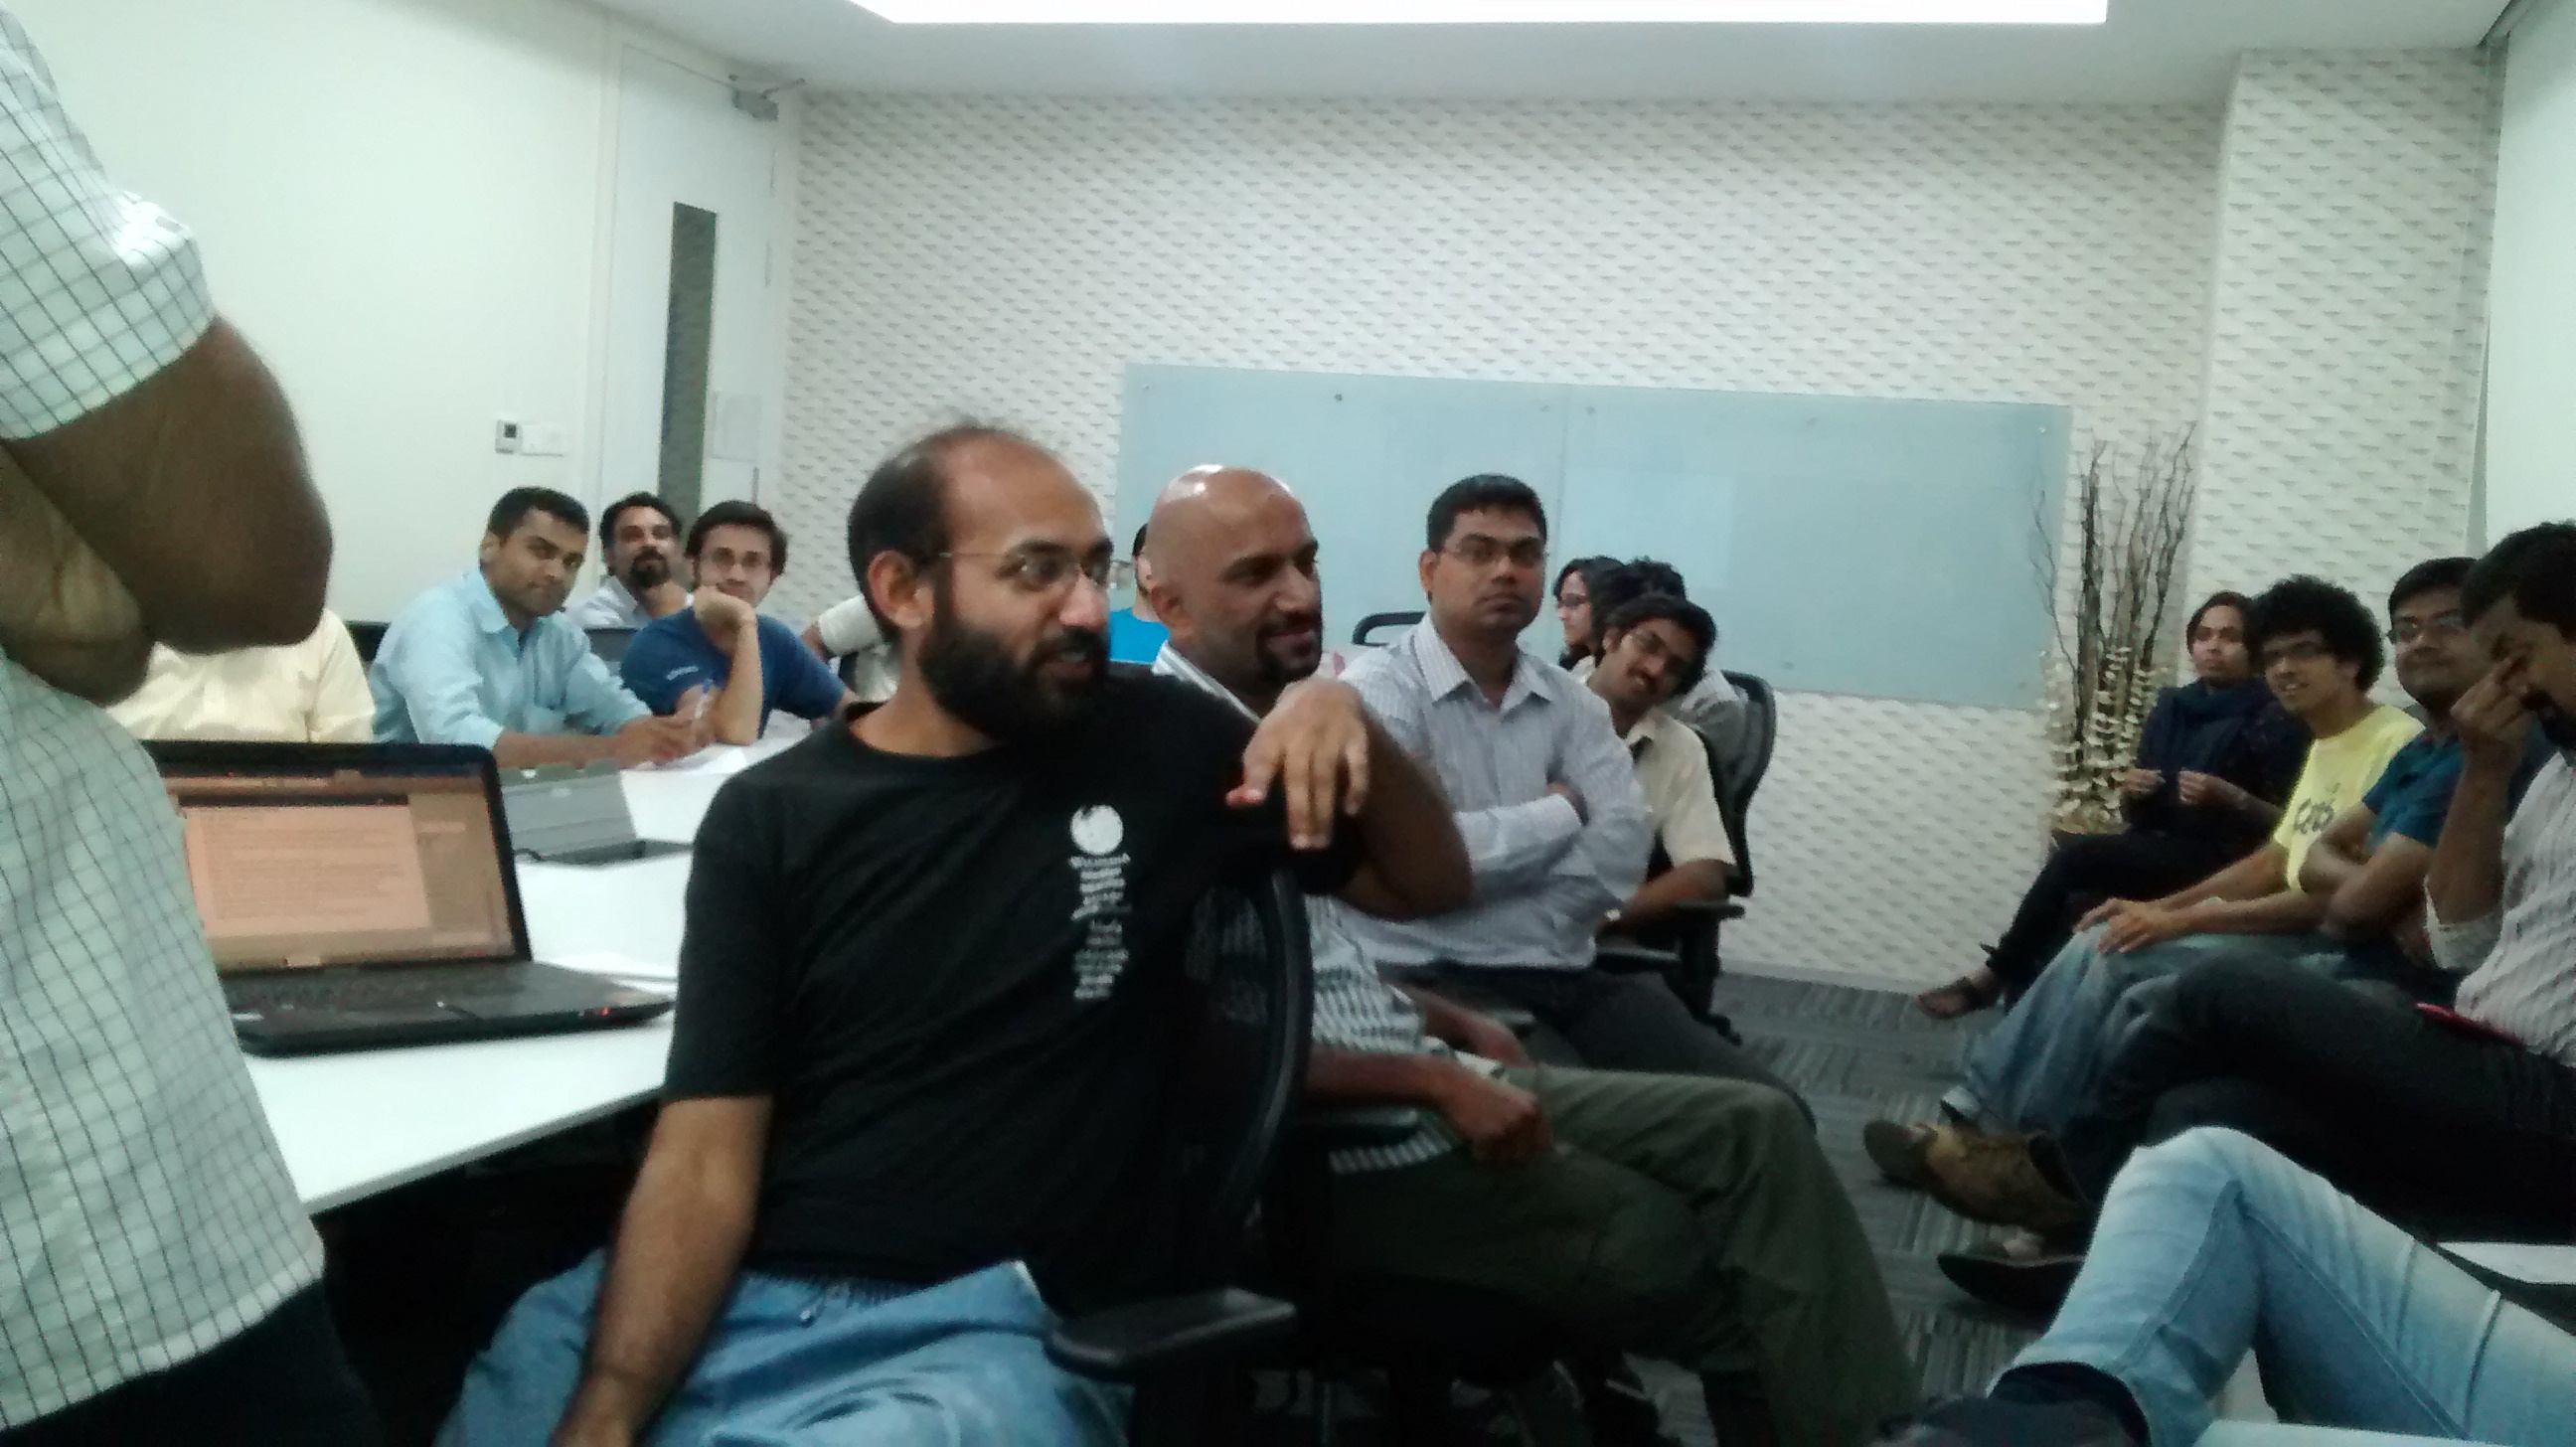
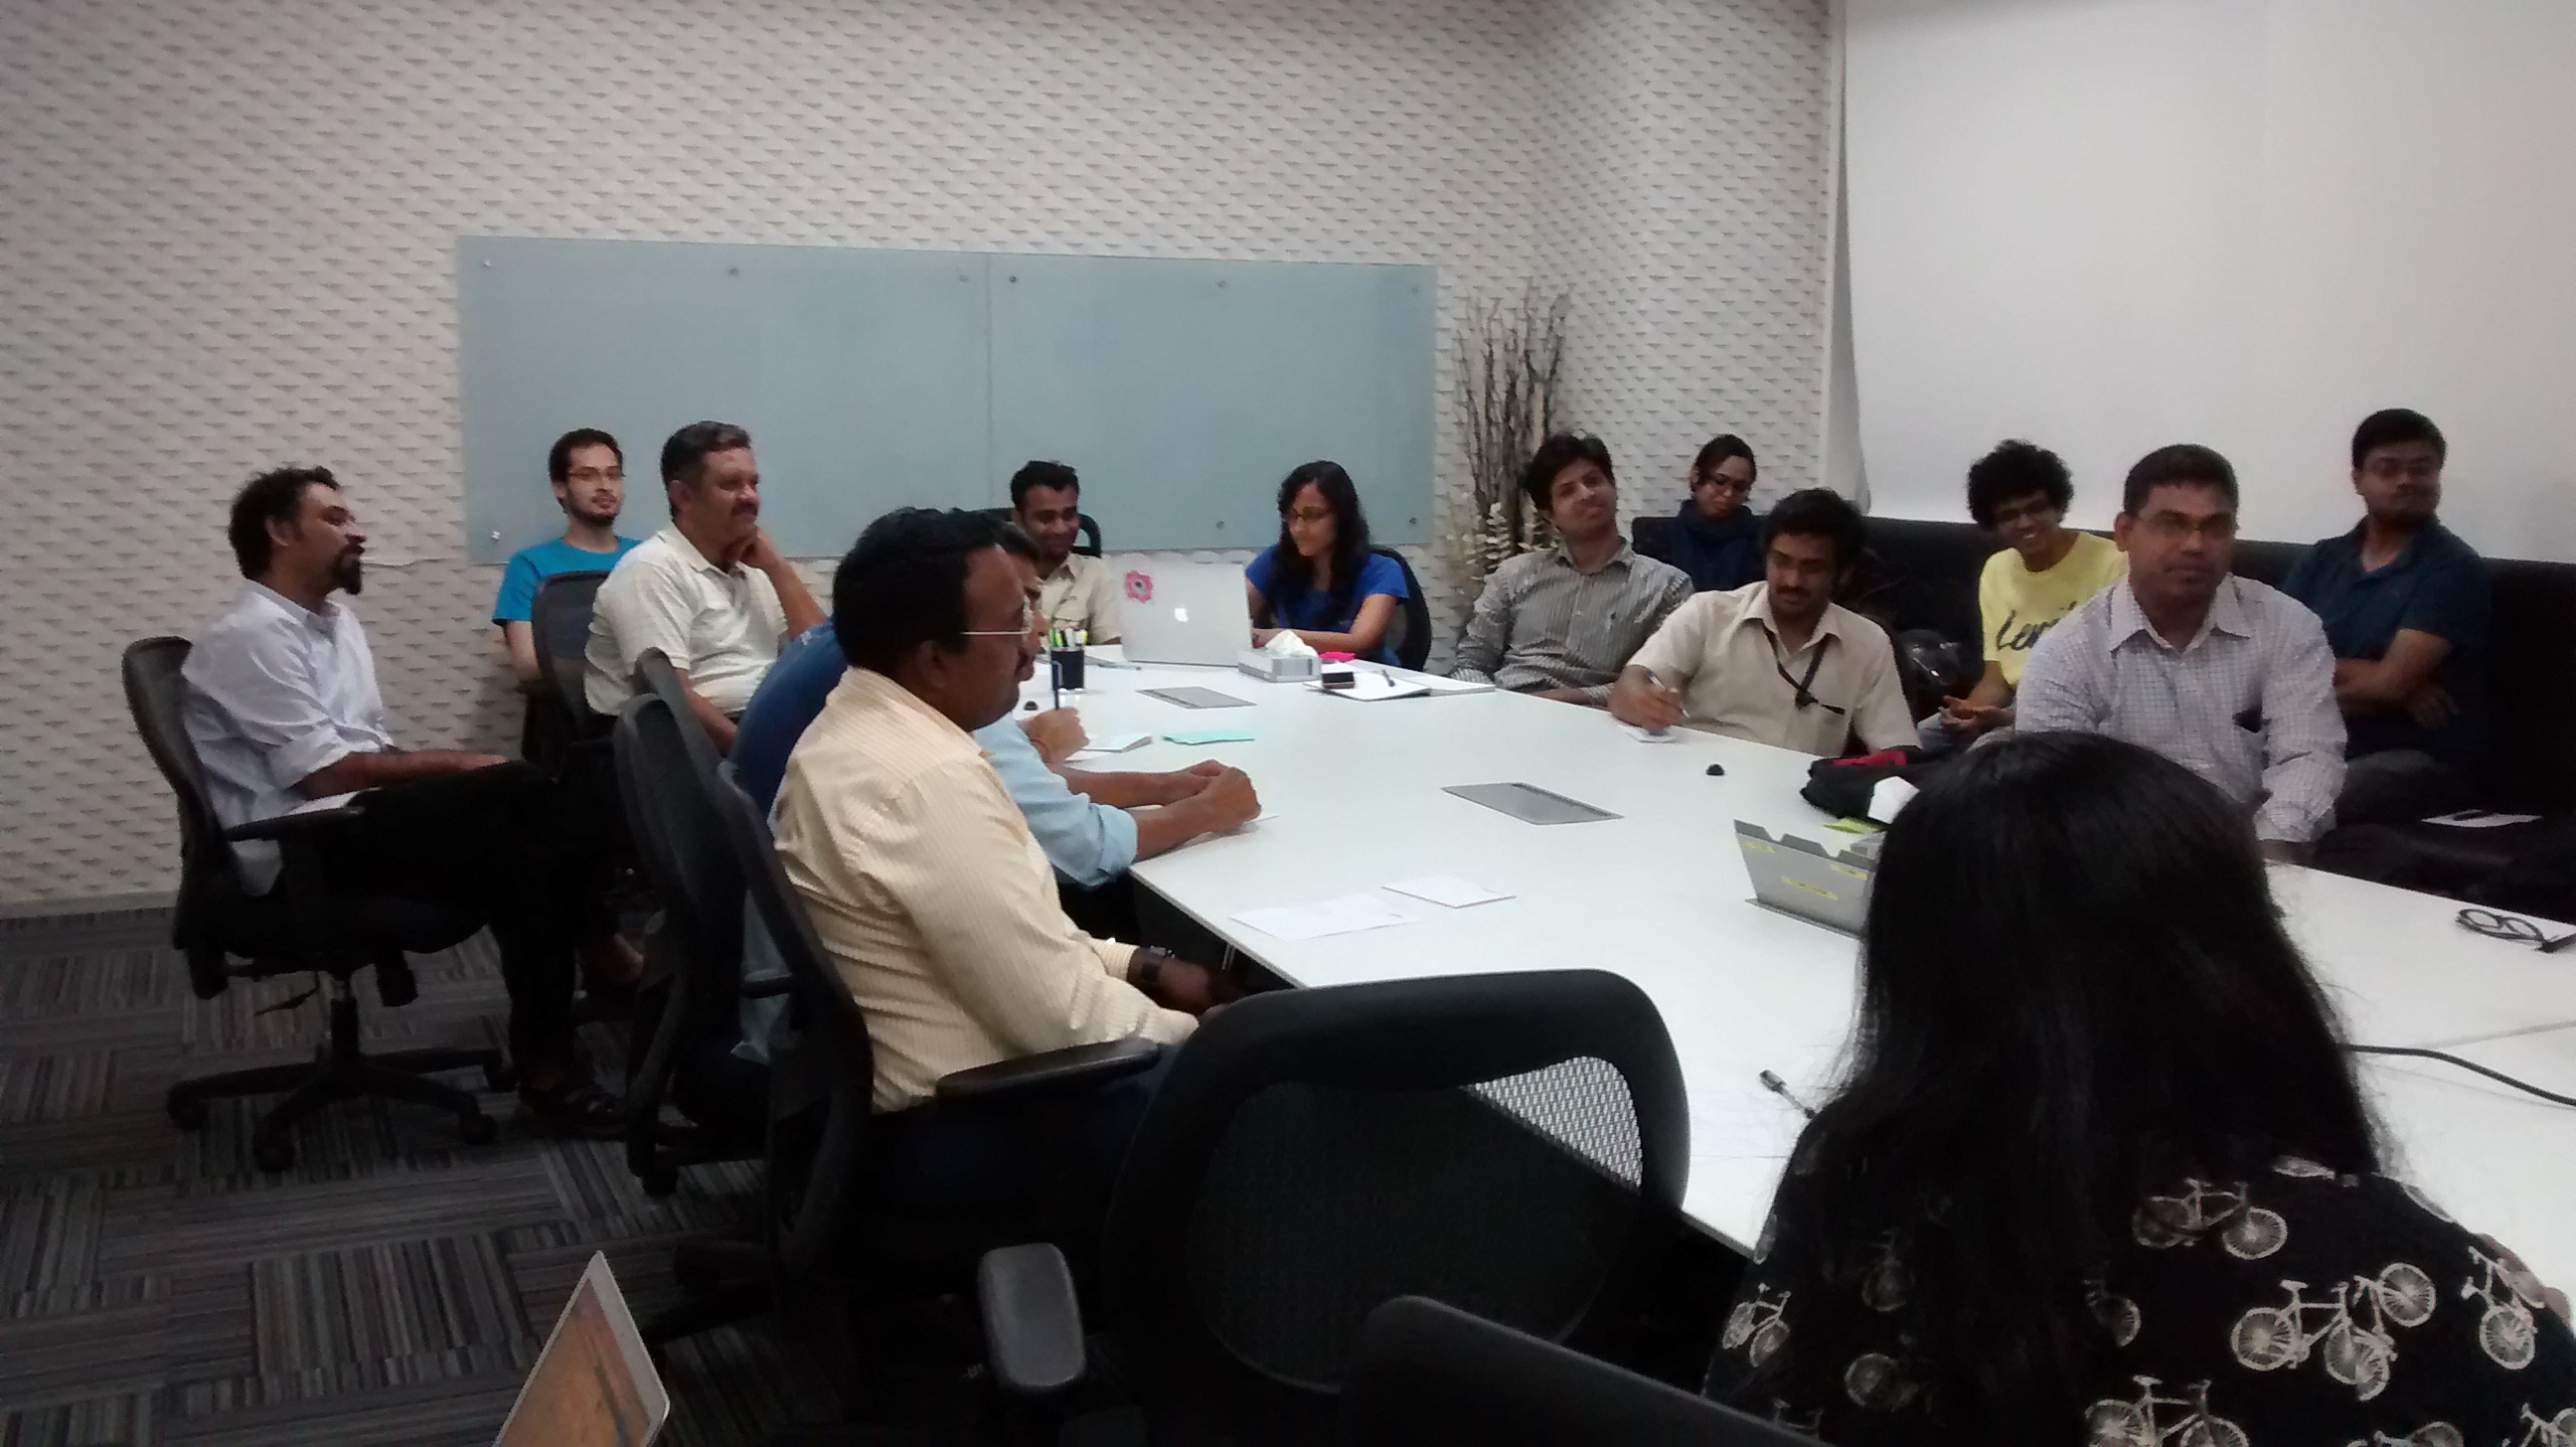
DataMeet’s largely been a successful community but not a great organization. This is my fault. A lot of my decisions were guided by those early issues. It was important to have a group of people demonstrating demand, need, and solutions who weren’t paid to be advocates but who were interested in the problem and found a safe space to try to work on it. That is how you change culture, that is why I meed people who say I believe in open data because of DataMeet. That would not have happened as much if we just did projects.

You can’t fundamentally improve governance by having access to data.

It is what we work toward as a movement but it just doesn’t really work that way- because bad governance is not caused by the lack of information or utilization of data. Accountability can’t happen without information or data; and good governance can’t happen without accountability. But all the work spent on getting the government to collect and better use data is often not useful. Mostly because of the lack of understanding of what is the root cause of the issue. I found that budget problems, under staffing, over stressed fire fighting, corruption, interest groups, and just plain apathy are more to blame then really the lack of information. This is something that civil society has to relearn all the time. Not to say data can’t help with these things, but if your plan is to give the government data and think it will solve a problem you are wasting time. Instead you should be using that data to create accountability structures that the government has to answer to. Or use that data to support already utilized accountability influences.

You gotta collect data

Funding that doesn’t include data collection, cleaning, processing costs is pointless. Data collection is expensive but necessary. In a context like India’s where it is clear that the government will not reach data collection levels that are necessary, you have to look at data collection as a required investment.  India’s large established civil society and social sector is one of its strongest assets and they collect tons of data but not consistently. A lot of projects I encountered were based on the western models of the data being there, even if not accessible, it is complete somewhere. NOPE. They count on the data existing and don’t bother to think about the problem of collection, clean up, processing, and distribution. You have to collect data and do it consistently it has to become integrated in your mission.

Data is a pretty good indicator of how big a gap exists between two people trying to communicate.

100% of every data related conversation goes like this “The data says this but I know from experience that…. ” Two people will have different values and communicating a value by saying “I think you should track xyz also, because its an important part of the story” can be a very productive way to work out differences. That is why open data methodology is so important. It also becomes a strong way for diverse interests to communicate and that is always a good thing.

Data is a common

In places that still don’t have the best infrastructure. Where institutions and official channels aren’t the most consistent. The best thing you can do is make information open and free. It will force issues out, create bigger incentives for solutions, and those solutions will be cheaper. Openness can be a substitute for money if there is an ecosystem to support the work.

You can collect lots of data but keeping it gets society no where.

A lot of people in India are wasting a lot of time doing the same thing over and over again. If I had 5 rupees for every person I spoke to who said they had already processed a shapefile that we just did, or had worked with some other dataset that is hard to clean up I could buy the Taj Mahal. Data issues in the country are decades old, but not sharing it causes stunting. Momentum is created from rapid information sharing and solutions; proprietary systems and data hoarding doesn’t. The common societal platforms that are making their way around India’s civil society and private company meeting rooms won’t do it either. You can’t design a locked in platform with every use in mind, its why generally non open portals have had such limited success. If you have solved a hard problem and make it open you save future generations from having to literally recreate the wheel you just made. How much more brainpower can you dedicate to the same problems? Let people be productive on new problems that haven’t been solved yet.

The data people in government are unsung heroes.

Whenever I met an actual worker at the NIC or BHUVAN or any of the data/tech departments they were very smart, very aware of the problems, and generally excited about the idea of DataMeet and that we could potentially help them solve a problem. It was not uncommon when being in a meeting with people from a government tech project for them to ask me to lobby another ministry to improve the data they have to process. While I wish I had that kind of influence it made me appreciate that the government is filled with people trying their best with the restrictions they have, but the government has “good bones” as they say and with better accountability could get to a better place.

I don’t think I covered everything but I’m very grateful for my time working on these issues in India. I feel like I was able to achieve something even though there is so much more to do. To meet all the people who are dedicated to solving hard problems with others and never giving up will inspire me for a long time.


Home for All our Maps

Over the years DataMeet community has created/cleaned lots of maps and made them available on GitHub. One of the biggest issue we had was visibility. Larger community couldn’t find them using google or couldn’t figure out how-to download maps or use them. Basically we lacked documentation. Happy to say we have started working on it

The home of all the projects will be

http://projects.datameet.org/maps/

From there you will be able to find links to others, This is the link you can use to share in general. More links below.

Most documentation have description of the map, fields, format, license, references and a quick view as to how the map looks. For example check the Kerala village map page.

There is a little bit of work left in documenting the Municipality maps. I am working on them. Otherwise documentation is in a usable state. P

lease add your comments or issues on GitHub or respond here. Each page has a link to issues to page on Github. You can use it.

In future I will try to add some example usage, links to useful examples and tutorials and also build our reference page. I am hoping

Thanks to Medha and Ataulla for helping to document these projects.

A few days back I also wrote about Community Created Free and Open Maps of India, let me know if I have missed any projects. I will add.

Map links

On github they remain same, We have mainly three maps repos

Happy Independence Day and Open Indian Village Boundaries

One of the longest and most passionately discussed subject on the Data{Meet} list is the availability of Indian Village Boundaries in Digital format. Search for Indian Village shape files and you can spend hours on reading interesting conversations.

Over last two years different members of community have tried to digitize the maps available through various government platforms or shared the maps through their organizations.

A look at the list discussion tells you that boundaries of at the least 75% of the states are available in various formats and quality. What we need at this point is a consolidate effort to bring them all on par in format, attributes and to some level quality. So some volunteers at Data{Meet} agreed to come together, clean up the available maps, add attributes, make them geojson and publish them on our GitHub repository called Indian Village Boundaries.

Of course this will be an on going effort but we would love to reach a baseline (all states) by year end. As of now I have cleaned up and uploaded Gujarat. I have at the least 4 more states to go live by month end. Karnataka, Kerala, Tamil Nadu and Goa. I will announce them on the list as they go live.

The boundaries are organized by state using state ISO code. All the village boundaries are available in geojson (WGS84, EPSG4326) format. The project page gives you the status of the data as we clean and upload. Data is not perfect yet, there could many errors both in data and boundaries. You can contribute by sending the pull requests. Please use the census names when correcting the attributes and geojson for shapes. Please source them to an official source when sending corrections.

Like everything else community creates. All map data will be available under Open Data Commons Open Database License (ODbL). This data is distributed in the hope that it will be useful, but WITHOUT ANY WARRANTY; without even the implied warranty of MERCHANTABILITY or FITNESS FOR A PARTICULAR PURPOSE. If you find issues we are more than happy to accept corrections but please source them to an official source.

On this 70th Independence day, as we celebrate the historic event of India becoming Free and Independent, Data{Meet} community celebrates by cleaning, formatting and digitizing our village boundaries. Have a great time using the maps and contributing back to society.

https://github.com/datameet/indian_village_boundaries

Picture: Kedarnath range behind the Kedarnath temple early morning. By Kaustabh, Available under CCBYSA.

Analysing Bangalore’s Bus Network

Open Bangalore has been a pioneer in opening up several data sets that help understand Bangalore city. This includes the network of Bangalore Metropolitan Transport Corporation (BMTC). The BMTC operates over 2000 routes in the city and region of Bangalore and is the only real mode of public transit system in the city. Some of us at DataMeet took to time understand its network better by performing some basic analysis on the gathered dataset. The data set had bus stops, routes and trips. We inspected frequency, coverage, redundancy and reachability.

Longest route

BMTC is known for its many long routes. Route 600 is the longest, making a roundtrip around the city, covering 117 km in about 5 hours. There are 5 trips a day, and these buses are packed throughout. It should be noted that while the route traces the edges of the city in the west and north, it encircles the larger industrial clusters of the east and south.

View the map full screen.

Frequency

Next, I wanted to look at the frequency of different routes. In the image below, stroke thickness indicates how many trips each route makes. The relationship of the bus terminals with neighbourhoods and the road network can be easily observed. For instance, the north and west of the city have fewer, but more frequent routes. Whereas, the south has more routes with less frequency. Also, nodes in the north and west seem to rely more on the trunk roads than the diversely-connected nodes in the south. One can easily trace the Outer Ring Road, too.

View the map full screen.

Reachability

I tried to define reachability as destinations one can get to from a stop without transferring to another bus. The BMTC network operates long and direct routes. The map shows straight lines between bus stops that are connected by a single route. The furthest you can get is from Krishnarajendra Market (KR Market) to the eastward town of Biskuru: roughly 49 km as the crow flies.

View the map full screen.

Direction

Which directions does BMTC run? It is interesting that BMTC covers the city North – South (blue) and East – West (brown) with almost equal distribution.

View the map full screen.

Coverage

BMTC routes are classified into different series. Starting from 1 – 9 and A – W. I analysed coverage based on series 2 (blue) and 3 (green) and they make up almost 76% of the entire network.

View the map full screen.

Redundancy

Tejas and I took turns to try and figure out the redundancy within the network. Redundancy is good to absorb an over spill of bus commuters. Redundancy is a drain on resources and makes it hard to manage such a vast network with efficiency. So, we looked at segments that overlapped different bus routes.

View interactive map.

Node strength

This map by Aruna shows node strength – number of routes passing through a particular stop. You can see that the strength decreases as we move away from the city center with the exception of depots.

View interactive map.

Just like the data, our code and approach are open on Github. We would love to hear from you, and have conversations about the visualization, the BMTC, and everything in between!

Map of Electoral districts of Sri Lanka

SriLankan maps for Electoral districts are available for download now. I initially made this for a friend who wanted to analyze the election results. The Electoral districts are derived from the administrative maps.

via GIPHY

You can check the diff on github to see how the maps were changed.

GADM database of Global Administrative Areas is the source of administrative data. I used three simple online tools

  • GeoJSON.io for converting from KML to GeoJSON and adding attributes.
  • MapShaper for merging the areas
  • GitHub for storing the map files.

Note: I don’t provide any guarantee on the accuracy of the maps. So don’t use if you want accurate maps. I have made notes on how these maps were derived. Use it if you think the process is right. Raise an issue if you find anything.

Guest Post: Varun Goel- Releasing Data for Agriculture

RRAN_logoVarun serves as the chief data scientist at a research team led by Dr. Ashwini Chhatre, serves as the Research Node of the Revitalizing Rainfed Agricultural Network – an India wide network of NGOs, civil society organizations, researchers, policy makers and think-tanks that aim to reconfigure the nature, amount and delivery of public investments for productive and resilient rainfed agriculture. 

The Combined Finance and Revenue Accounts (CFRA) report is an annual report prepared by the office  of the Comptroller and Auditor General (CAG) of India to provides comprehensive Union and State government data on audited receipts, revenue expenditures and capital outlay for different major, minor and sub-minor heads.

Since the figures for actual expenditures on different heads may differ from actual  budget allocation by as much 15 to 20 percent, and that each state might have different procedures of auditing, the CFRA data provides reliable and fairly disaggregated figures of public expenditure, audited by a central authority.

The research team at the Revitalizing Rainfed Agricultural Network (RRAN) has scraped and processed the CFRA data from 2005-06 to 2010-11 for all general and economic services to understand statewide public investments in agriculture and allied activities, and highlight the mismatch in investment and needs on the ground.

The processed data, along with detailed information for each head can be forked here.

Although the data is only available at the state level, it can provide valuable insight on not just public expenditure in other domains such as urban development, health, central and state sponsored schemes, but also highlight the differences in budget allocation and actual spending of various government heads.

Revitalizing Rainfed Agricultural Network (RRAN) has practice and policy node that generates ground based evidence and block, district and state level for policy engagement, the research node’s objective is to generate evidence for testing key hypotheses to enable an articulation of the nature and magnitude of public support needed to fuel growth of India’s rainfed agriculture. To facilitate this, a Data Center has been set up with the aim of acquiring, reconciling, processing, visualizing and disseminating pan India datasets to assist in exploratory analysis and develop research hypothesis, backing up policy advocacy through scientifically rigorous data analysis, and implementing data-driven decision-making tools for program implementation by grass-roots level organizations.

Nobel prize Winner Angus Deaton on the importance Open Data in India

On Data{Meet} we have been talking about the importance of Open Data and quality of it. This year’s winner of the Nobel Prize for Economics Angus Deaton has similar point of view on the quality of open data. Whole article is worth reading, I am quoting a paragraph.

My work shows how important it is that independent researchers should have access to data, so that government statistics can be checked, and so that the democratic debate within India can be informed by the different interpretations of different scholars. High quality, open, transparent, and uncensored data are needed to support democracy.

I have used data from India’s famous National Sample Surveys to measure poverty. Perhaps the biggest threat to these measures is that there is an enormous discrepancy between the National Accounts Statistics and the surveys. The surveys “find” less consumption than do the national accounts, whose measures also grow more rapidly. While I am sure that part of the problem lies with the surveys—as more people spend more on a wider variety of things, the total is harder to capture—but there are weaknesses on the NAS side too, and I have been distressed over the years that critics of the surveys have got a lot more attention than critics of the growth measures. Perhaps no one wants to risk a change that will diminish India’s spectacular (at least as measured) rate of growth?

Source: TheWire
Picture credit: Nobel Prize

Data{Meet} Pune – First Meetup

Datameet Pune, hosted its first meetup last Monday, the 13th of July at Thoughtworks, Pune. The idea of DataMeet which originated in Bangalore as a community of data enthusiasts, working on civic issues has now spread to several cities across the country, Pune being the latest.

Datameet Pune - First Meetup (1)

Twenty-six people of diverse backgrounds, both from the programming world (students and professionals) as well as those conversant with social sector issues (NGOs and citizens) attended the meeting (including 3 via Google Hangout). A icebreaker and a game of Pune related trivia got the meeting off to a start. Participants introduced themselves and their broad areas of interest. Ideas revolved around public transport, voter registration, land use change, water and sanitation, waste management, education, mapping, data visualization and more. The organizers then gave a brief presentation on the idea of DataMeet, examples of data successes in the social sector elsewhere and the possible scope of projects that can be explored within the Pune group. Nikhil welcomed those interested to pitch in on some of his projects related to Pune’s bus routes management system and Pune’s budget sheet.

Datameet Pune - First Meetup (2)

The floor was then open to the participants to QnA and ideas. Participants discussed the format of further engagement within the group. They agreed that it would be best to start off with monthly meetings organized around topics (related to data and civic issues) where a speaker could initiate discussion based on his/her experience. Topics suggested were mapping, basic statistics, R/Python, better data analysis with Excel, etc. Dev, Vinayak and Rasagy originally from the Bangalore DataMeet agreed to initiate discussions on possible topics. Rahul, urged that the topics taken up by speakers should have a practical orientation rather than being more theoretical, since seeing practical applications tends to interest people more. Sanskriti also suggested sector specific meetups for example on transport, since the Pune public transport service (PMPML) is launching a new BRT route. Participants were briefed about hackathons and Open Data Camps (ODCs) which have happened in other cities and it was suggested that Pune could explore these formats as well.

The forum for online engagement of the Pune group, suggested by Vinayak, was Slack.com, to which everyone was agreeable. (a Slack channel was later setup for the Pune group on the main Datameet Slack). For in-person meetings, everyone agreed to meeting once a month, and Saturday was the day agreeable to most, early evening or morning were suggested as possible timings. Additional venues, including CEE, Drive Change, Flame University and Indradhanushya were also suggested. A meetup page was setup by Anurag, for updates about future meetups.

Participants were also strongly urged to fill out the DataMeet Pune Interest Form to hear about future activities, available here. The meeting was overall a great success,the participants showing a lot of enthusiasm for actively collaborating together. Please stay tuned for announcements of future meetings. In the meanwhile you can find the Google Hangout recording of the meeting here. For Pune specific queries please email pune@datameet.org or contact Craig/Nikhil.

Craig D: 7276085960, craigds022@gmail.com or Nikhil VJ: 9665831250, nikhil.js@gmail.com

Open Transit Data for India

(Suvajit is a member of DataMeet’s Transportation working group, along with Srinivas Kodali, we are working on how to make more transit related data available.)

Mobility is one of the fundamental needs of humanity. And mobility with a shared mode of transport is undoubtedly the best from all quarters – socially, economically & environmentally. The key to effective shared mode of transport (termed as Public Transport) is “Information”. In India cities, lack of information has been cited as the primary reason for deterrence of Public Transport.

Transport Agencies are commissioning Intelligent Transport Systems (ITS) in various mode and capacity to make their system better and to meet the new transport challenges. Vehicle Tracking System, Electronic Ticketing Machines, Planning & Scheduling software are all engines of data creation. On the other side, advent of smart mobile devices in everyone’s hand is bringing in new opportunities to make people much more information reliant.

But the demand for transit data is remarkably low. The transit user and even transit data users like City Planners should demand for it.
The demand for Public Transport data in India should be for the following aspects:

A. Availability
To make operation and infrastructure data of Transport operators easily available as information to passengers in well defined order to plan their trip using available modes of Public Transport.

B. Interoperability
To make transit data provided by multiple agencies for different modes (bus, metro, rail) usable and make multi modal trip planning possible.

C. Usability
To publish transit oriented data in standard exchange format across agencies in regular frequencies to provide comprehensive, accurate and updated data for study, research, analysis, planning and system development.

D. Standardisation
To be a part of Passenger charter of Transport Operators to publish their data in standard format and frequency. This can also serve as a guideline for Transporter Operator while commissioning any system like Vehicle Tracking System, ITS, Passenger Information System, website etc.

What kind of Transit data is needed ?

  • Service Planning data

It will comprise of data on bus stops, stations, routes, geographic alignment, timetables, fare charts. With this dataset, general information on transit service can be easily gathered to plan a journey. Trip Planning mobile apps, portals etc can consume this data to provide ready and usable information for commuters.

  • Real time data

A commuter is driven by lot of anxieties when they depend on public transport mode. Some common queries; “When will the bus arrive ?”, “Where is my bus now?”, “Will I get a seat in the bus ?”, “Hope the bus has not deviated and not taking my bus stop.”.

Answer to all this queries can be attended via real time data like Estimated Time of Arrival (ETA), Position of the vehicle, Occupancy level , Alert and Diversion messages etc. Transport Operator equipped with Tracking systems should be able to provide these data.

  • Operational & Statistical Data

A Transport Operators operational data comprises of ticket sales, data of operation infrastructure and resources like Depots, Buses, Crew, Workshops etc. As operatore are tending towards digital mode of managing these data it also makes a good option to publish them at regular intervals.

A general commuter might not be interested in this data, but it will very useful for City Planners to analyse the trend of commute in the city and make informed decision. City transport infrastructure can be planned to orient it towards transit needs and demands.

The transport agency can benefit highly by demonstrating accountability and transparency. They can uplift their image as a committed service provider thereby gaining for passengers for their service.

So, together it will make a thriving landscape, if the data creators of Public Transport in India provide their data in Open which can be consumed by a larger set of people to build platforms, applications, solutions for transport study, analysis & planning across different section of users.

Open Transit Data is the tipping point for Smart Mobility in India.

That is why we have started putting our thoughts together and began writing an Open Transport Data Mainfesto.

GeoBLR – PIN Code Extravaganza!

Last week at GeoBLR we discussed the issues around PIN codes. The most  important questions were around the processes the postal system and also what are the issues around the availability of reliable spatial data.

Couple of weeks back, Nisha and I started putting together several questions that we would like to get insights on. We used that as the starting point for the discussions. The meat of the problem really is that nobody knows what the processes are and how to get that information.

Prior to GeoBLR, we met some people who are interested in the same issue and clarified a lot of things – for instance, we are now sure that some times a single post office can deal with more than one PIN code.

To get a sense how people felt about the PIN codes issues, we asked around. Some people don’t bother to use PIN codes for any substantial service other than sending post cards.  As long as we are not able to tie PIN codes to geographic locations reliably, it’s not so useful.  Everybody agrees that it has immense potential just because it’s the only part of the address that everybody gets right (most of the time).

We also started to brainstorm how to come up with a plan so that a group like ours along with several other partners could work together to attempt to crowdsource the issue. Read more about the plan and next steps here!

20140821_191027 20140821_191035