Tag Archives: Maps

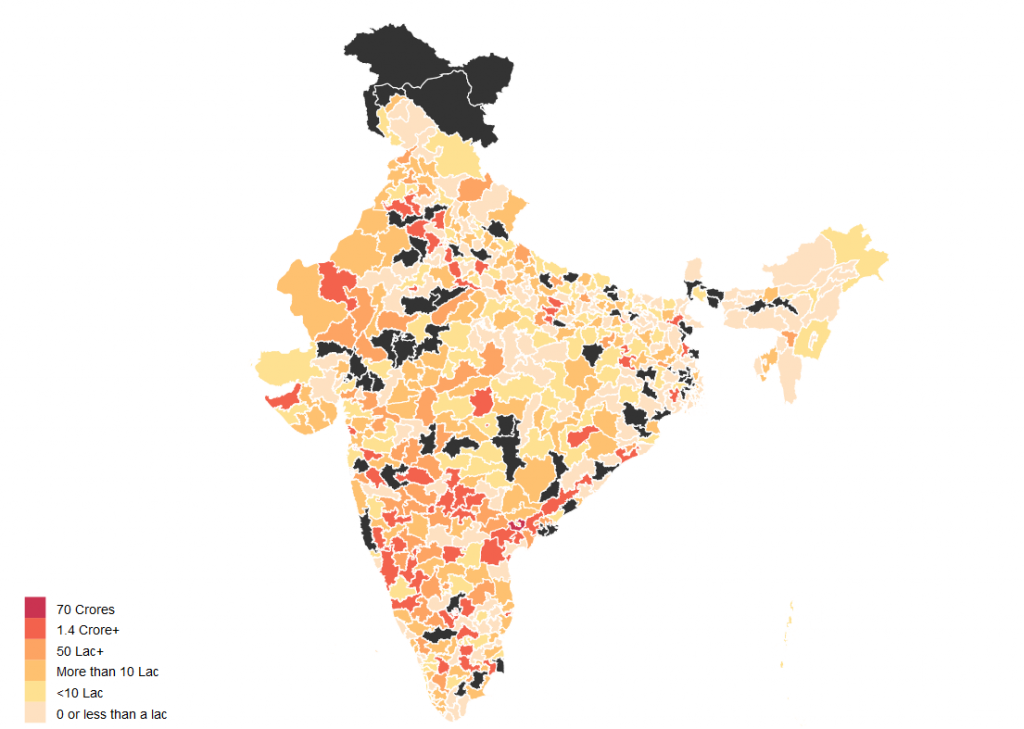
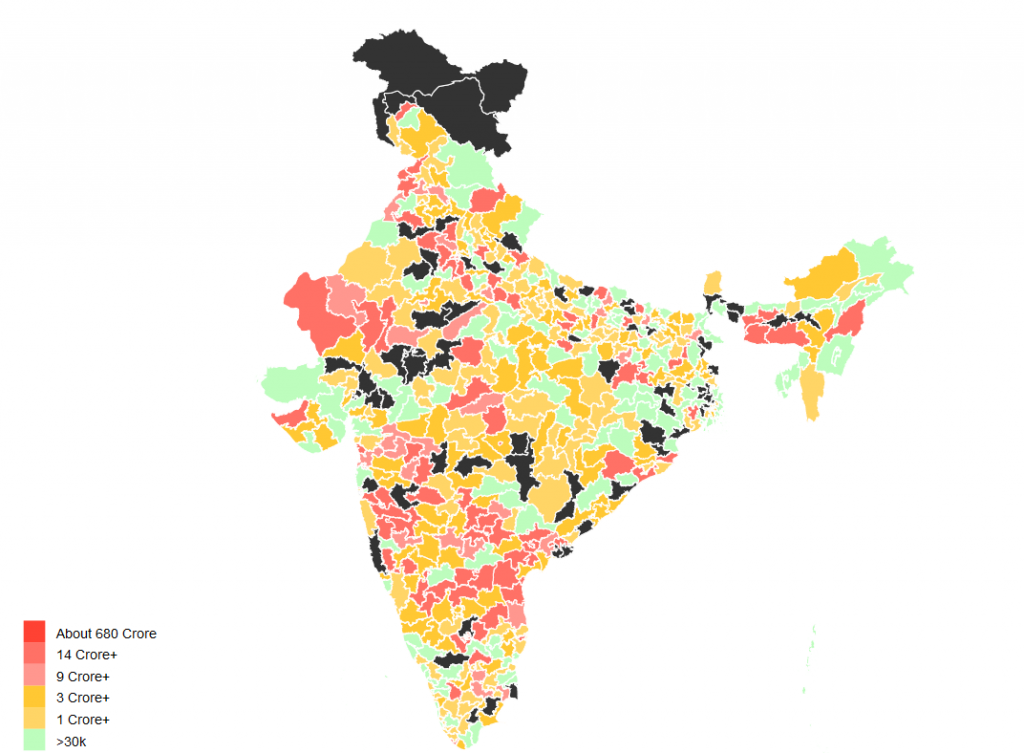
Know Your MP: Probing Election Affidavits with Maps

Project by Shailendra Paliwal and Kashmir Sihag
Note: This blog post was written by Shailendra

I want to share a 3 year old project I and my friend Kashmir Sihag Chaudhary did for Jaipur Hackathon in a span of 24 hours. It is called Know Your MP, it visualizes data that we know about our members of parliament on a map of Indian Parliamentary Constituencies.

A friend and a fellow redditor Shrimant Jaruhar had already made something very similar in 2014 but it was barely usable since it took forever to load and mostly crashed my browser. My attempt with Know Your MP was to advance on the same idea.

The Dataset

Election Commission of India requires that every person contesting the elections fill an affidavit and therby disclosing criminal, financial and educatinal background of each candidate. There have been a few concerns about this, a major one being that one could as well enter misleading information without any consequences. If you would remember the brouhaha over education qualifications of Prime Minister Modi and the cabinet minister Smriti Irani, it started with what they entered in their election affidavits. However, it is widely believed that a vast majority of the data colllected is true or close to true which makes this a dataset worthy of exploration.

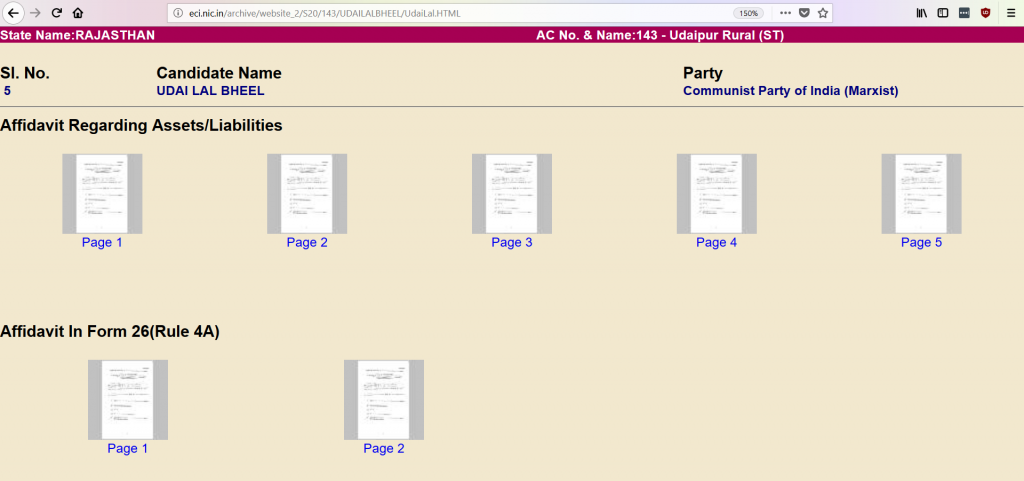
However, like a lot of data from governments, every page from these affidavits are made available as individual images behind a network of hyperlinks on the website of Election Commission of India. Thankfully, all of this data is available as CSV or Excel Spreadsheets from [MyNeta.info](http://myneta.info/). The organization behind MyNeta is Association of Democratic Reforms(ADR) which was established by a group of professors from Indian Institute of Management (Ahmedabad). ADR also played a pivotal role in the Supreme Court ruling that brought this election disclosure to fruition.
everything is neatly laid out


Cadidate Affidavit of CPI(M) candidate Udai Lal Bheel from Udaipur Rural constituency in Rajasthan. link

Preparing the Map

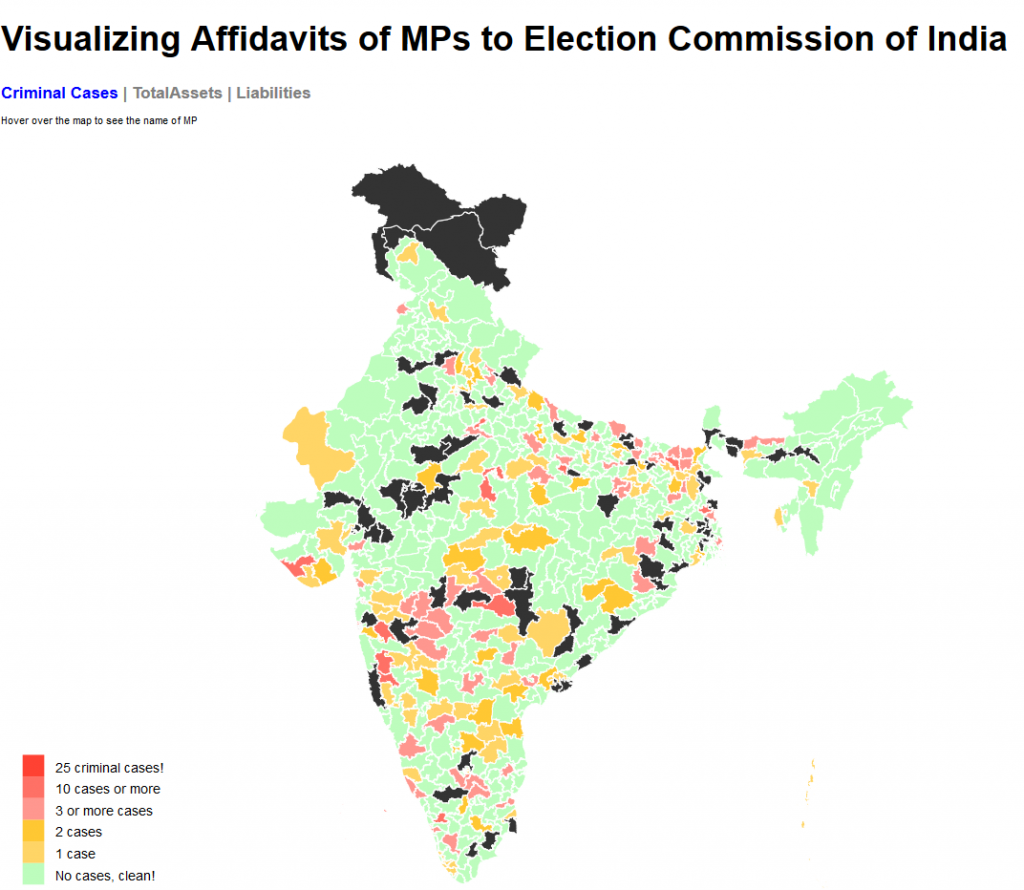
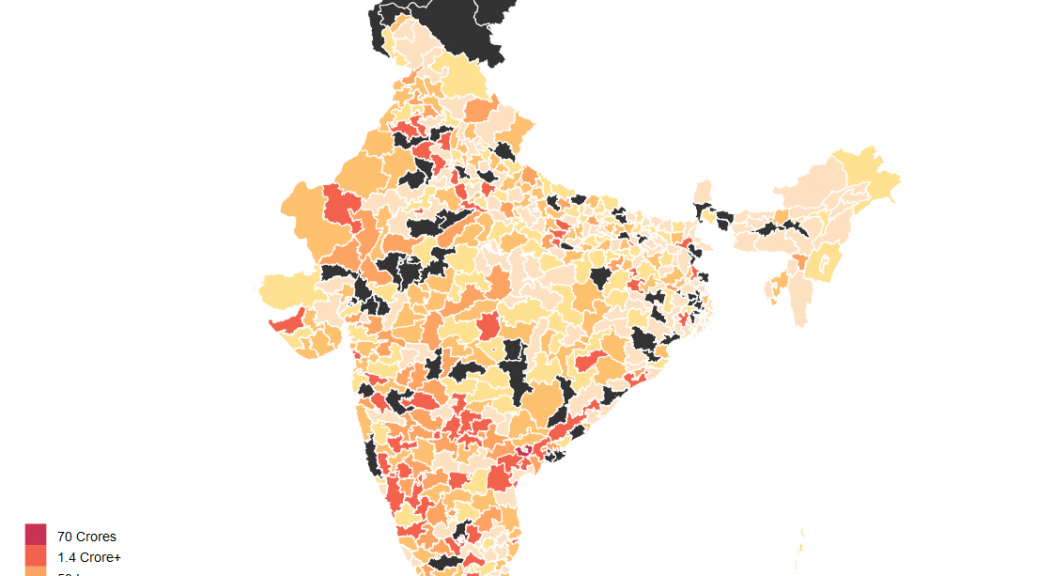
This data needs to be visualized on a map with boundaries showing every parliamentary contituency. Each constituency will indicate the number of criminal cases or assets of their respective MP using a difference in shading or color. Such visualizations are called choropleth maps. To my surprise, I couldn not find a map of Indian parliamentary constituencies from any direct or indirect government sources. That is when datameet came to my rescue. I found that DataMeet Bangalore had released such a shapefile. It is a 13.7MB file(.shp). Certainly not usable for a web project.

Next task would be somehow compress this shapefile to a small enough size that can be then used either as a standalone map or as an overlay on leaflet.js or Google Maps (or as I later learned Mapbox too).

From the beginning I was looking at d3.js to achieve this. The usual process to follow would be to convert the shapefile (.shp) into JSON format which D3 can use.

For map compression I found that Mike Bostock (a dataviz genius and also the person behind D3) has worked on a map format that does such compression, the format is called GeoJSON. After a bit of struggling with making things work on a Windows workstation and tweaking around with the default settings, I managed to bring the size down to 935 KB. Map was now ready for the web and I now had to only wade through D3 documentation to make the visualization.

Linking data with map and Visualization

Each parliamentary region in the GeoJSON file has a name tag which links it to the corresponding data values from dataset. A D3 script on the HTML page parses both and does this job to finally render this choropleth map.

The black regions on the maps are parliamentary contituencies that have alternate spellings. I could have used levenshtein distance to match them or more simply linked the map to data with a numeric ID. I’ll hopefully get that done someday soon.

link to project, github, map

Finally Looking at Data

The average member of parliment (only a few MPs have changed since 2015) has at least 1 criminal case against them, has a total asset value of about 14 Crore INR and has liabilities of value 1.4 Crore INR. But this dataset also has a lot of outliers so mean isn’t really the best representative of the central tendency. The median member of parliament has 0 criminal case against them, has total assets worth 3.2 Crore INR and has liabilities of value 11 Lakh INR.

The poorest member of parliament is Sumedha Nand Saraswati from Sikar who has total assets worth 34 thousand INR. Richest MP on the other hand is Jayadev Galla with declared assets of 683 Crore INR. Galla doesn’t directly fit the stereotypical corrupt politician meme with zero criminal cases against him. His wealth is best explained to the success of lead acid battery brand Amaron owned by the conglomerate his father founded in 1985.
Home for All our Maps

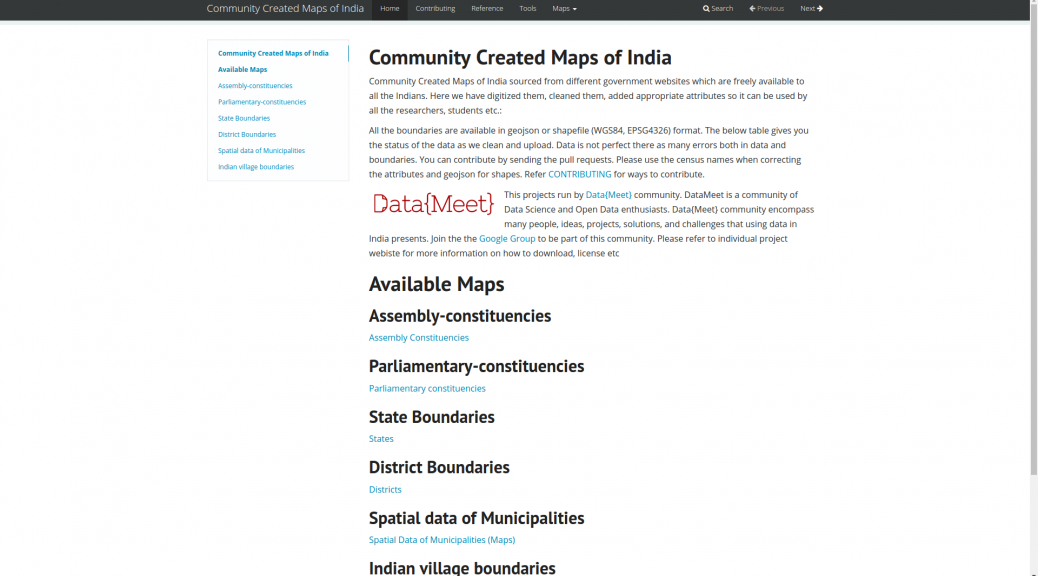
Over the years DataMeet community has created/cleaned lots of maps and made them available on GitHub. One of the biggest issue we had was visibility. Larger community couldn’t find them using google or couldn’t figure out how-to download maps or use them. Basically we lacked documentation. Happy to say we have started working on it

The home of all the projects will be

http://projects.datameet.org/maps/

From there you will be able to find links to others, This is the link you can use to share in general. More links below.

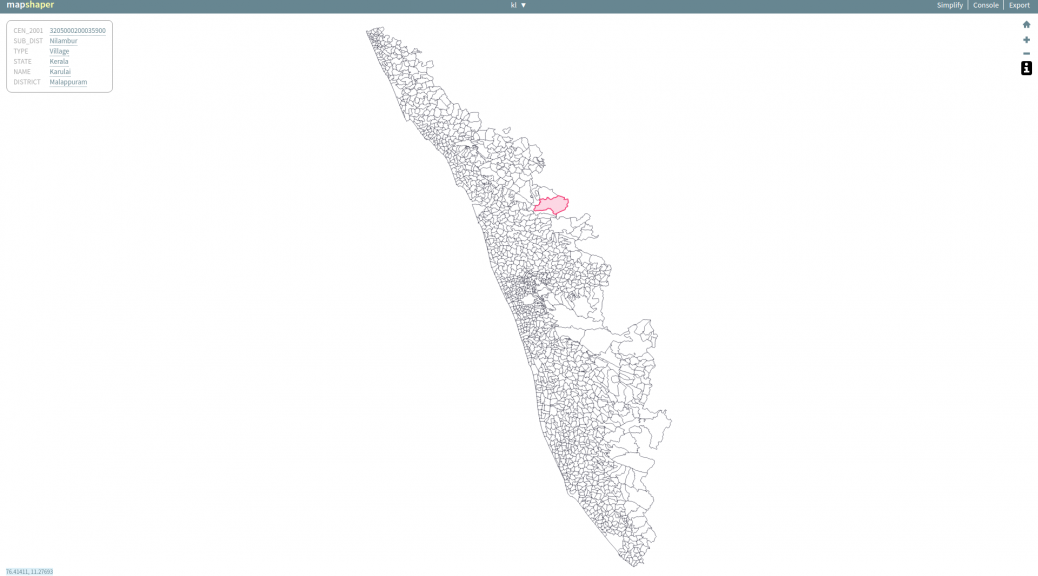
Most documentation have description of the map, fields, format, license, references and a quick view as to how the map looks. For example check the Kerala village map page.

There is a little bit of work left in documenting the Municipality maps. I am working on them. Otherwise documentation is in a usable state. P

lease add your comments or issues on GitHub or respond here. Each page has a link to issues to page on Github. You can use it.

In future I will try to add some example usage, links to useful examples and tutorials and also build our reference page. I am hoping

Thanks to Medha and Ataulla for helping to document these projects.

A few days back I also wrote about Community Created Free and Open Maps of India, let me know if I have missed any projects. I will add.

Map links

On github they remain same, We have mainly three maps repos

Happy Independence Day and Open Indian Village Boundaries

One of the longest and most passionately discussed subject on the Data{Meet} list is the availability of Indian Village Boundaries in Digital format. Search for Indian Village shape files and you can spend hours on reading interesting conversations.

Over last two years different members of community have tried to digitize the maps available through various government platforms or shared the maps through their organizations.

A look at the list discussion tells you that boundaries of at the least 75% of the states are available in various formats and quality. What we need at this point is a consolidate effort to bring them all on par in format, attributes and to some level quality. So some volunteers at Data{Meet} agreed to come together, clean up the available maps, add attributes, make them geojson and publish them on our GitHub repository called Indian Village Boundaries.

Of course this will be an on going effort but we would love to reach a baseline (all states) by year end. As of now I have cleaned up and uploaded Gujarat. I have at the least 4 more states to go live by month end. Karnataka, Kerala, Tamil Nadu and Goa. I will announce them on the list as they go live.

The boundaries are organized by state using state ISO code. All the village boundaries are available in geojson (WGS84, EPSG4326) format. The project page gives you the status of the data as we clean and upload. Data is not perfect yet, there could many errors both in data and boundaries. You can contribute by sending the pull requests. Please use the census names when correcting the attributes and geojson for shapes. Please source them to an official source when sending corrections.

Like everything else community creates. All map data will be available under Open Data Commons Open Database License (ODbL). This data is distributed in the hope that it will be useful, but WITHOUT ANY WARRANTY; without even the implied warranty of MERCHANTABILITY or FITNESS FOR A PARTICULAR PURPOSE. If you find issues we are more than happy to accept corrections but please source them to an official source.

On this 70th Independence day, as we celebrate the historic event of India becoming Free and Independent, Data{Meet} community celebrates by cleaning, formatting and digitizing our village boundaries. Have a great time using the maps and contributing back to society.

https://github.com/datameet/indian_village_boundaries

Picture: Kedarnath range behind the Kedarnath temple early morning. By Kaustabh, Available under CCBYSA.

Analysing Bangalore’s Bus Network

Open Bangalore has been a pioneer in opening up several data sets that help understand Bangalore city. This includes the network of Bangalore Metropolitan Transport Corporation (BMTC). The BMTC operates over 2000 routes in the city and region of Bangalore and is the only real mode of public transit system in the city. Some of us at DataMeet took to time understand its network better by performing some basic analysis on the gathered dataset. The data set had bus stops, routes and trips. We inspected frequency, coverage, redundancy and reachability.

Longest route

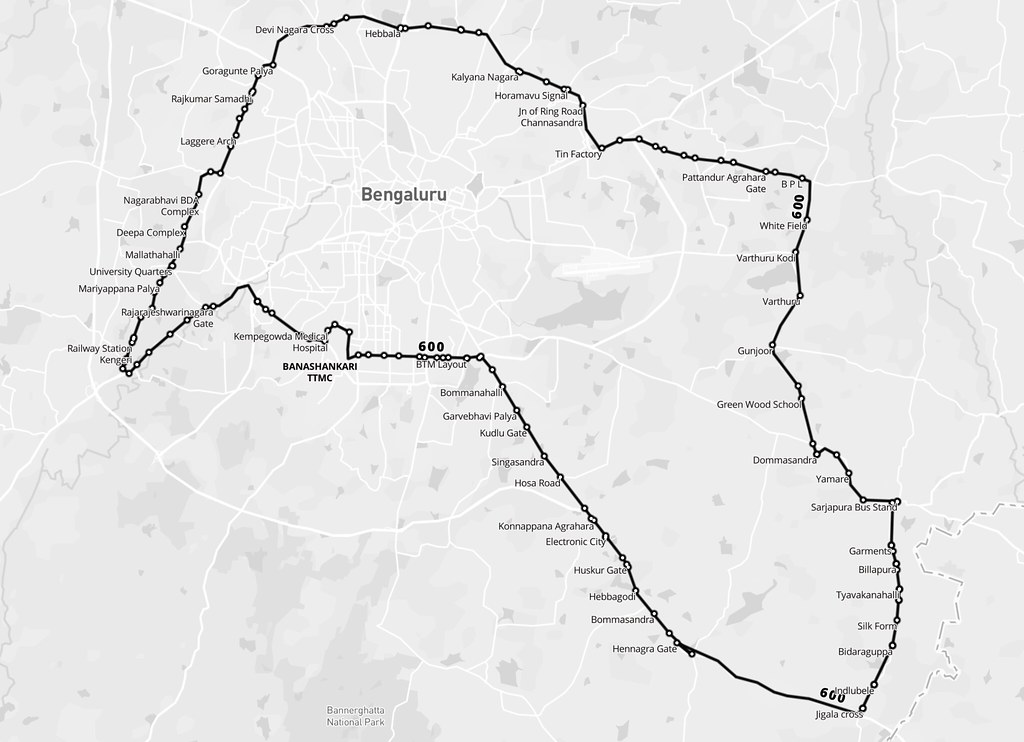
BMTC is known for its many long routes. Route 600 is the longest, making a roundtrip around the city, covering 117 km in about 5 hours. There are 5 trips a day, and these buses are packed throughout. It should be noted that while the route traces the edges of the city in the west and north, it encircles the larger industrial clusters of the east and south.

View the map full screen.

Frequency

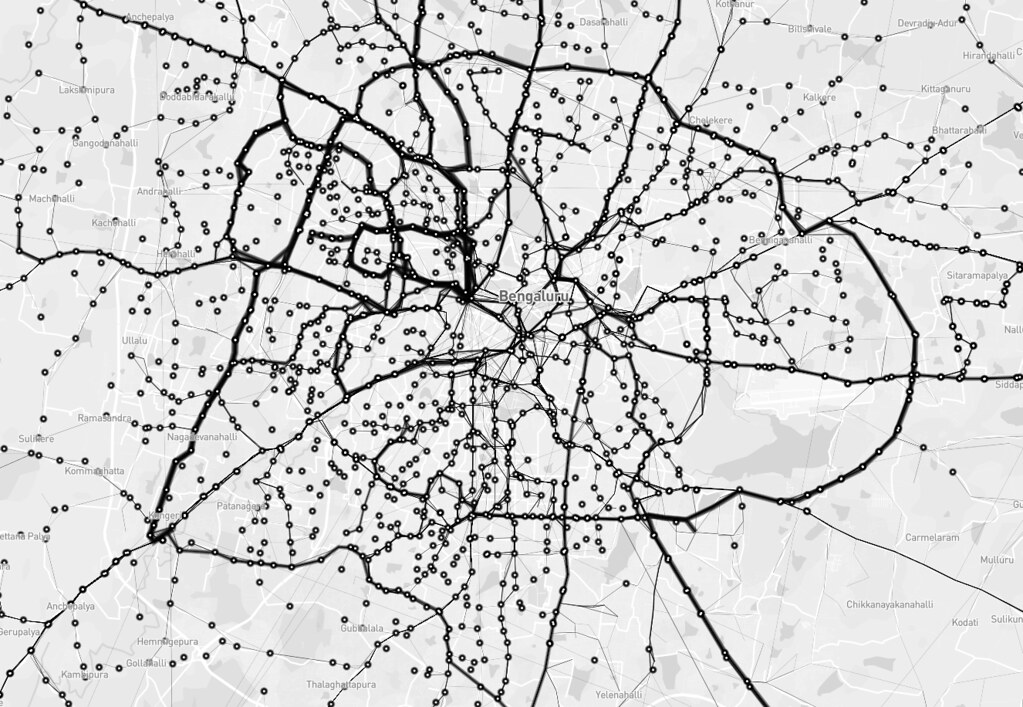
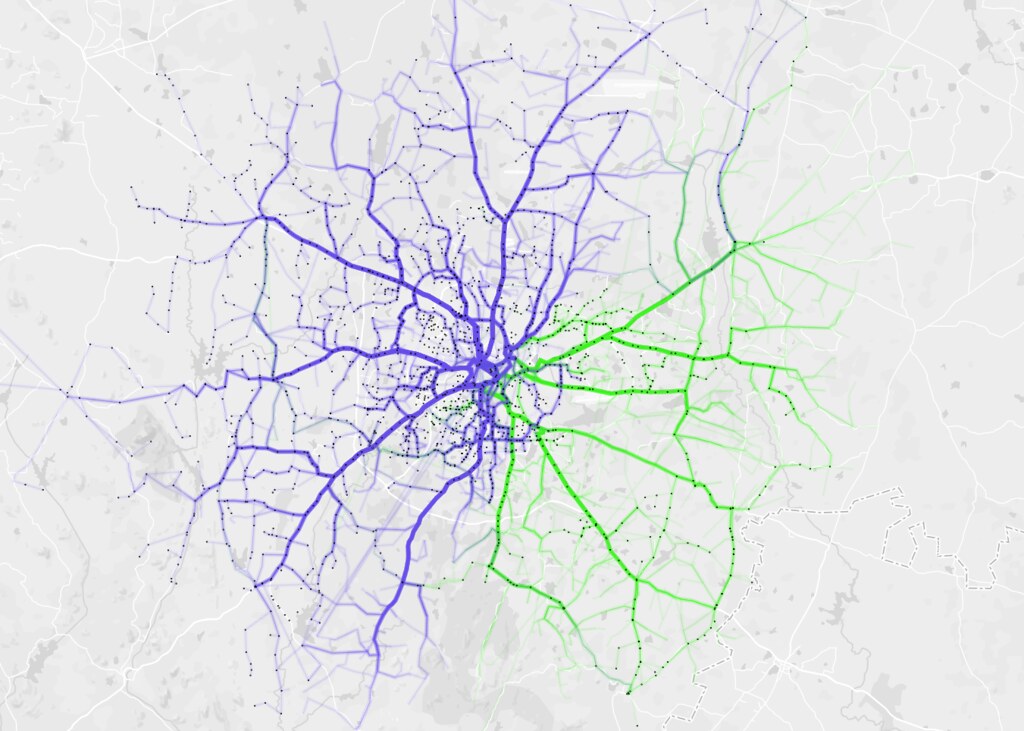
Next, I wanted to look at the frequency of different routes. In the image below, stroke thickness indicates how many trips each route makes. The relationship of the bus terminals with neighbourhoods and the road network can be easily observed. For instance, the north and west of the city have fewer, but more frequent routes. Whereas, the south has more routes with less frequency. Also, nodes in the north and west seem to rely more on the trunk roads than the diversely-connected nodes in the south. One can easily trace the Outer Ring Road, too.

View the map full screen.

Reachability

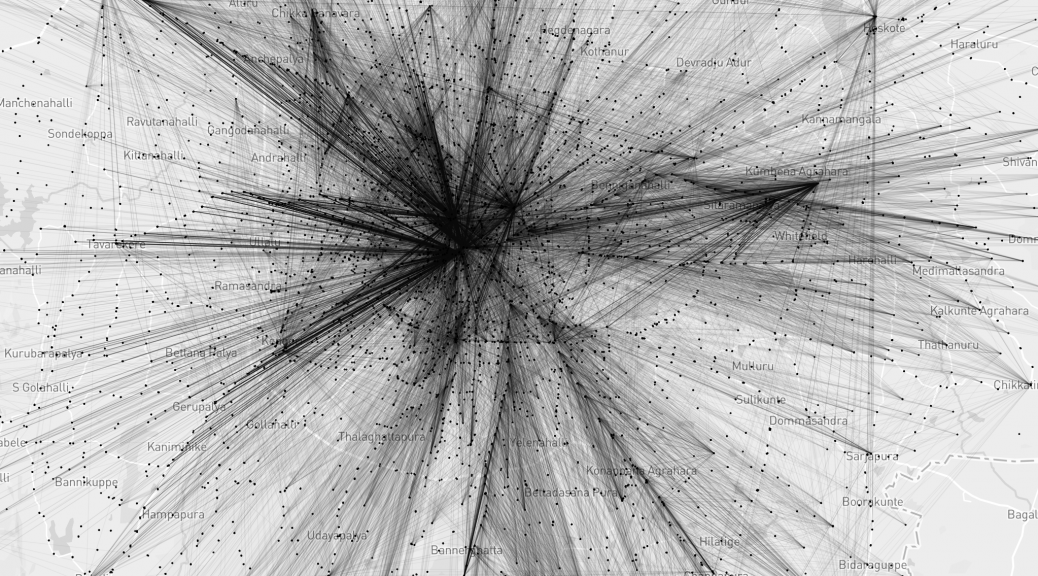
I tried to define reachability as destinations one can get to from a stop without transferring to another bus. The BMTC network operates long and direct routes. The map shows straight lines between bus stops that are connected by a single route. The furthest you can get is from Krishnarajendra Market (KR Market) to the eastward town of Biskuru: roughly 49 km as the crow flies.

View the map full screen.

Direction

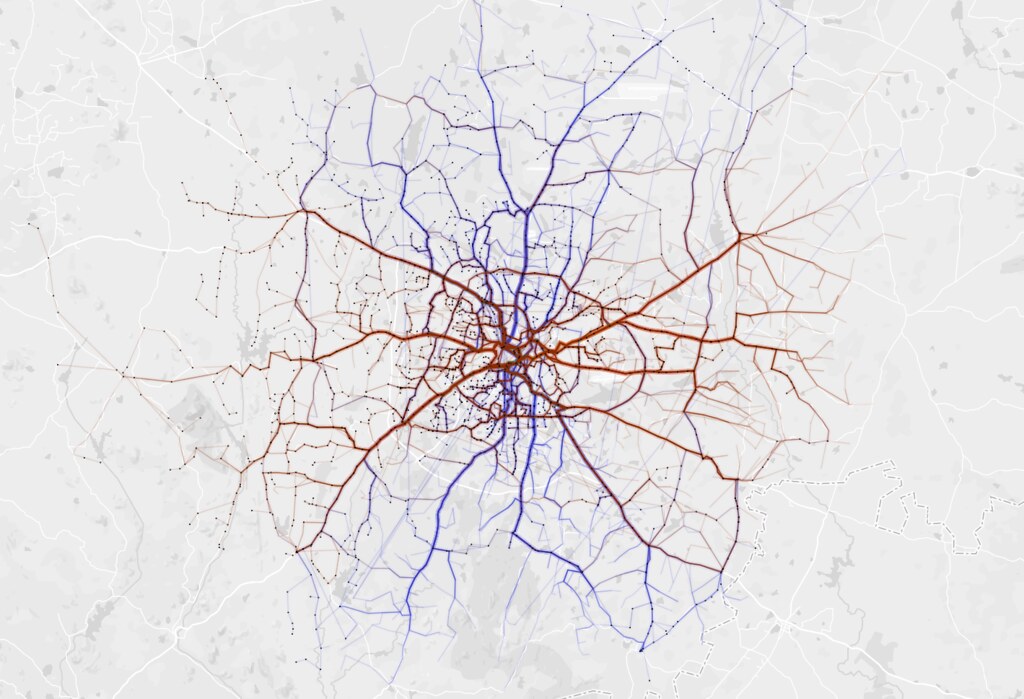
Which directions does BMTC run? It is interesting that BMTC covers the city North – South (blue) and East – West (brown) with almost equal distribution.

View the map full screen.

Coverage

BMTC routes are classified into different series. Starting from 1 – 9 and A – W. I analysed coverage based on series 2 (blue) and 3 (green) and they make up almost 76% of the entire network.

View the map full screen.

Redundancy

Tejas and I took turns to try and figure out the redundancy within the network. Redundancy is good to absorb an over spill of bus commuters. Redundancy is a drain on resources and makes it hard to manage such a vast network with efficiency. So, we looked at segments that overlapped different bus routes.

View interactive map.

Node strength

This map by Aruna shows node strength – number of routes passing through a particular stop. You can see that the strength decreases as we move away from the city center with the exception of depots.

View interactive map.

Just like the data, our code and approach are open on Github. We would love to hear from you, and have conversations about the visualization, the BMTC, and everything in between!

Map of Electoral districts of Sri Lanka

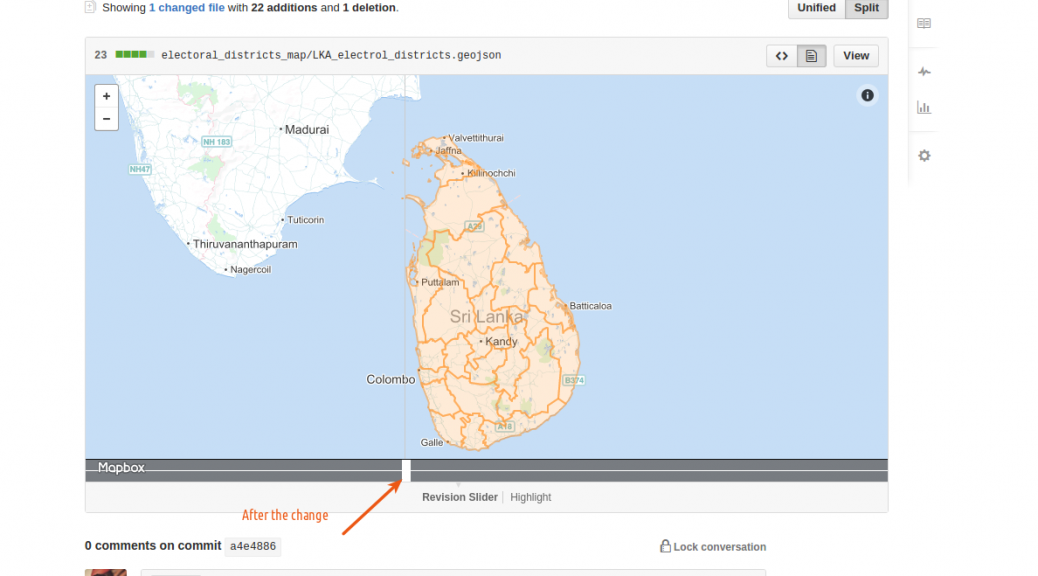
SriLankan maps for Electoral districts are available for download now. I initially made this for a friend who wanted to analyze the election results. The Electoral districts are derived from the administrative maps.

via GIPHY

You can check the diff on github to see how the maps were changed.

GADM database of Global Administrative Areas is the source of administrative data. I used three simple online tools

  • GeoJSON.io for converting from KML to GeoJSON and adding attributes.
  • MapShaper for merging the areas
  • GitHub for storing the map files.

Note: I don’t provide any guarantee on the accuracy of the maps. So don’t use if you want accurate maps. I have made notes on how these maps were derived. Use it if you think the process is right. Raise an issue if you find anything.

Latlong’s story of mapping India

The July edition of GeoBLR featured Rahul RS from Onze Technologies. Onze is the prefered store locator infrastructure by several businesses in India including TVS, Dell and Cafe Coffee Day. The store locator is powered by Onze’s very own Latlong.in – extensive, web based points of interest and map data interface.

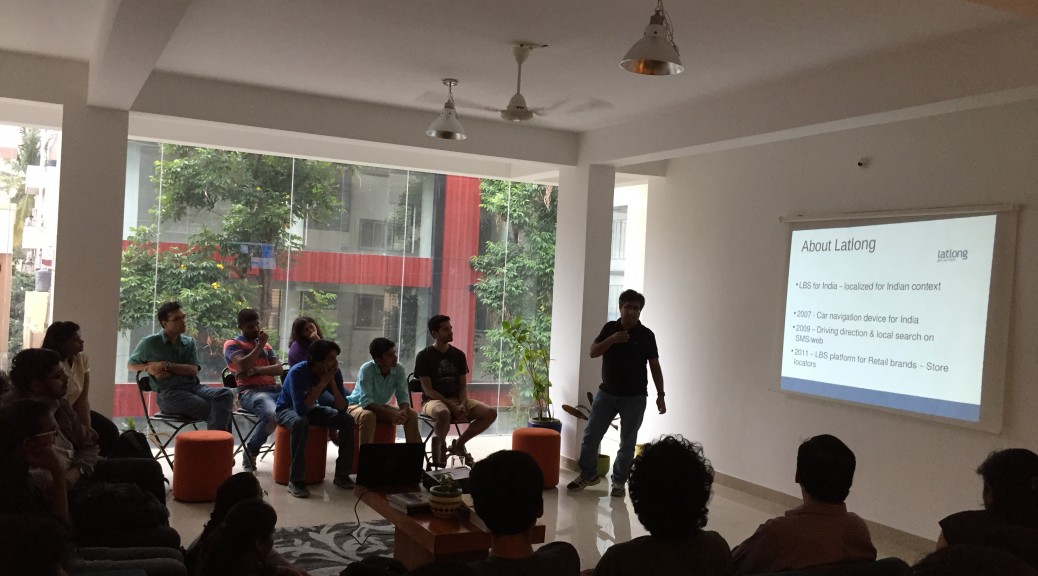
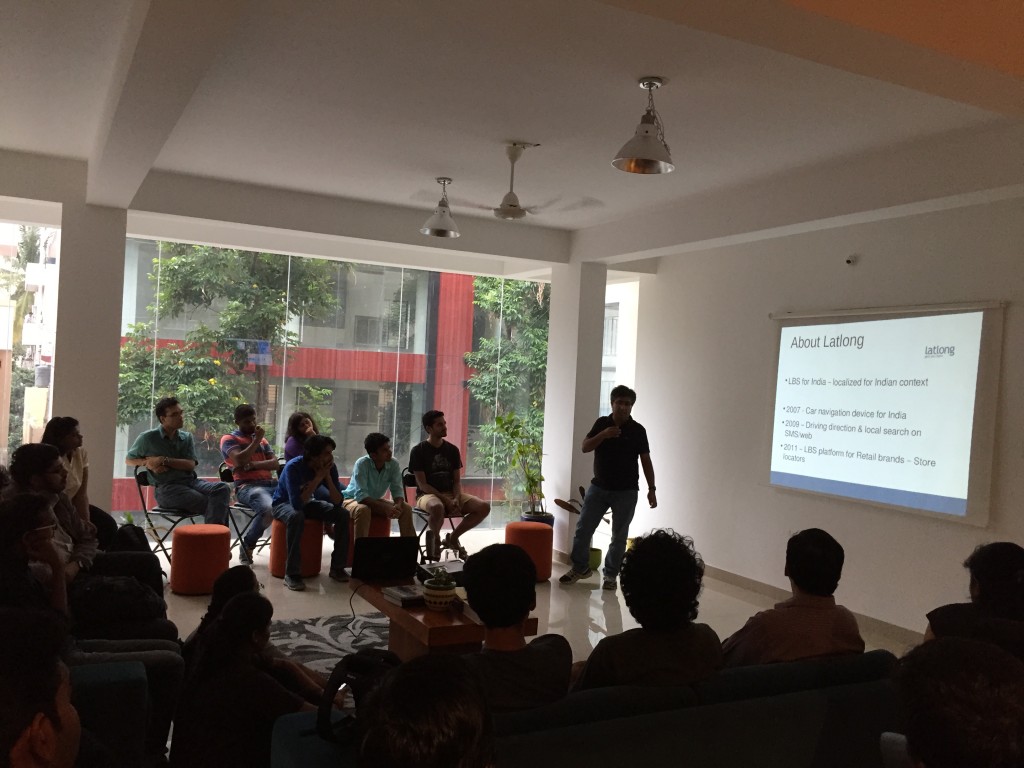
2015-07-30 18.23.40

Rahul shared the story of Latlong.in, their infrastructure and challenges mapping Indian cities. They started out in 2007 at a time when there was no reasonable geographic data source available for India – commercial and non-commercial. Rahul’s team gathered toposheets from the Survey of India and georeferenced boundaries to incorporate into their maps. Rahul pointed out that these are inexpensive but high effort tasks. Plus, tools to do these are expensive.

In order to address India-specific mapping needs, geo-rectification needed to be inevitably supported by field surveys. Each city is unique and people entirely depend on landmarks and hyperlocal information to get around. Rahul brought in experts from different areas to gather local information. “The idea behind Latlong.in starts by saying that addresses don’t work in India”, says Rahul. When OpenStreetMap picked up, Latlong.in moved to a mix of their data and OSM that was maintained on their own. It is a complicated effort. Conflation and dealing with multiple revisions of data is tricky and there aren’t great tools to deal with it effortlessly. Latlong.in follows Survey of India’s National Map Policy. They avoid mapping defence and high security features.

Owning the entire data experience is critical to win in this market. Remaining open and improving continuously is the only way to keep your datasets upto date.

Maps For Disaster Preparedness

screensavescreensaveDatameet, Mapbox and Akvo Foundation are organizing an OpenStreetMapping Party on 4th of July 2015 in New Delhi.

We are getting together to map  a few Indian cities and villages – improving road networks and infrastructure data in OpenStreetMap – the largest living map of the world. Join us to learn how to map on OpenStreetMap.

The Humanitarian OpenStreetMap Team activates in times of crisis to support responding organisations with map data, helping them better plan disaster response. Mappers around the world get together to improve road networks and infrastructure data in OpenStreetMap. The Humanitarian OpenStreetMap team leverages the OpenStreetMap platform in various directions to support crisis management with map data.

The impact we can make during a crisis is entirely dependent on the availability of map data. We will focus on understnding how maps and data can be used in the Indian context through a hands-on workshop, and integrate many of the lessons we learned first hand from the most recent earthquake that struck Nepal where over 2,000 volunteer from across the world came together to support the response efforts to quadruple road milage and add 30% more buildings in the most affect regions of Nepal.

Please visit the event page to RSVP or join the Facebook Event.

Francesca Recchia on Redressing Geopolitics

Among other goals this year for GeoBLR, we want to engage conversations that drift away from technical details of making maps and working with spatial data. In March, we featured Francesca Recchia to talk about geopolitics.

lbok

Francesca is an independent researcher and writer who has worked and taught in different parts of the world, including India, Iraq, Afghanistan, Pakistan, Palestine. She is interested in the geopolitical dimension of cultural processes and in recent years has focused her research on urban transformations and creative practices in countries in conflict.

Francesca spoke about her work in Kabul over the last two years around the Little Book of Kabul – exploring cultural practices by following Kabul’s own artists. Geographical and political borders and the construction of geopolitical imaginations have a profound impact on the way people think about and define themselves. She drew stories out of Mappa Mundi and Alighiero Boetti trying to connect how they reflect the geopolitical transformations of the world.

geoblr-francesca

Francesca says that the only way to understand politics and geopolitics and what this means for people in areas in conflict is to be amidst of it. This, she thinks is why one should work with artists and photographers.
Photos by Lorenzo Tugnoli

The GeoBLR Sprint 1 – July 3, 6pm – 8pm

I’m excited to announce the first GeoBLR Sprint! The event is happening at The Center for Internet and Society on July 3, 6pm – 8pm. (RSVP)

During the July meetup, we are asking participants to bring their problems around maps and spatial data to the event. Some of Bangalore’s own data experts will be at the event, who will engage in a two hour problem solving exercise with the participants.

Have some map data that needs cleaning? Trouble with map projections or data formats? Looking for some data but not quite sure where to find it? Difficulty choosing colours for your map? May be we can help!

We encourage participants to get in touch with us prior to the event to talk about the issues that they would like to preset. Write to us on hello@geoblr.in, or post a comment on our Meetup group, or write to me (me at sajjad dot in). We will select couple of  challenging problems and will recommend solutions for others.

http://www.meetup.com/GeoBLR/events/190931712/

See you at the event!

[mapsmarker marker=”5″]


If you are curious to know more about GeoBLR and why we are doing it, I wrote about it here.