Category Archives: How-To

Know Your MP: Probing Election Affidavits with Maps

Project by Shailendra Paliwal and Kashmir Sihag
Note: This blog post was written by Shailendra

I want to share a 3 year old project I and my friend Kashmir Sihag Chaudhary did for Jaipur Hackathon in a span of 24 hours. It is called Know Your MP, it visualizes data that we know about our members of parliament on a map of Indian Parliamentary Constituencies.

A friend and a fellow redditor Shrimant Jaruhar had already made something very similar in 2014 but it was barely usable since it took forever to load and mostly crashed my browser. My attempt with Know Your MP was to advance on the same idea.

The Dataset

Election Commission of India requires that every person contesting the elections fill an affidavit and therby disclosing criminal, financial and educatinal background of each candidate. There have been a few concerns about this, a major one being that one could as well enter misleading information without any consequences. If you would remember the brouhaha over education qualifications of Prime Minister Modi and the cabinet minister Smriti Irani, it started with what they entered in their election affidavits. However, it is widely believed that a vast majority of the data colllected is true or close to true which makes this a dataset worthy of exploration.

However, like a lot of data from governments, every page from these affidavits are made available as individual images behind a network of hyperlinks on the website of Election Commission of India. Thankfully, all of this data is available as CSV or Excel Spreadsheets from [MyNeta.info](http://myneta.info/). The organization behind MyNeta is Association of Democratic Reforms(ADR) which was established by a group of professors from Indian Institute of Management (Ahmedabad). ADR also played a pivotal role in the Supreme Court ruling that brought this election disclosure to fruition.

everything is neatly laid out


Cadidate Affidavit of CPI(M) candidate Udai Lal Bheel from Udaipur Rural constituency in Rajasthan. link
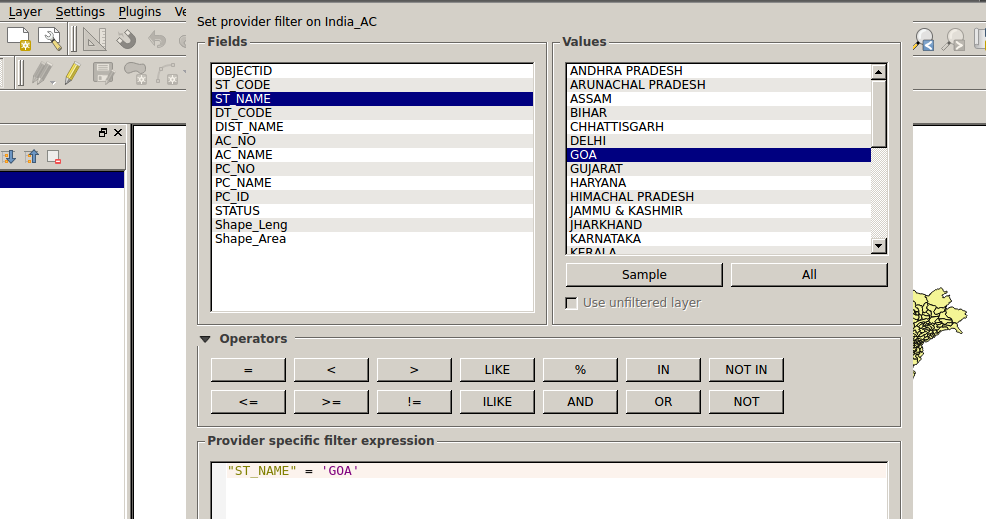
Preparing the Map

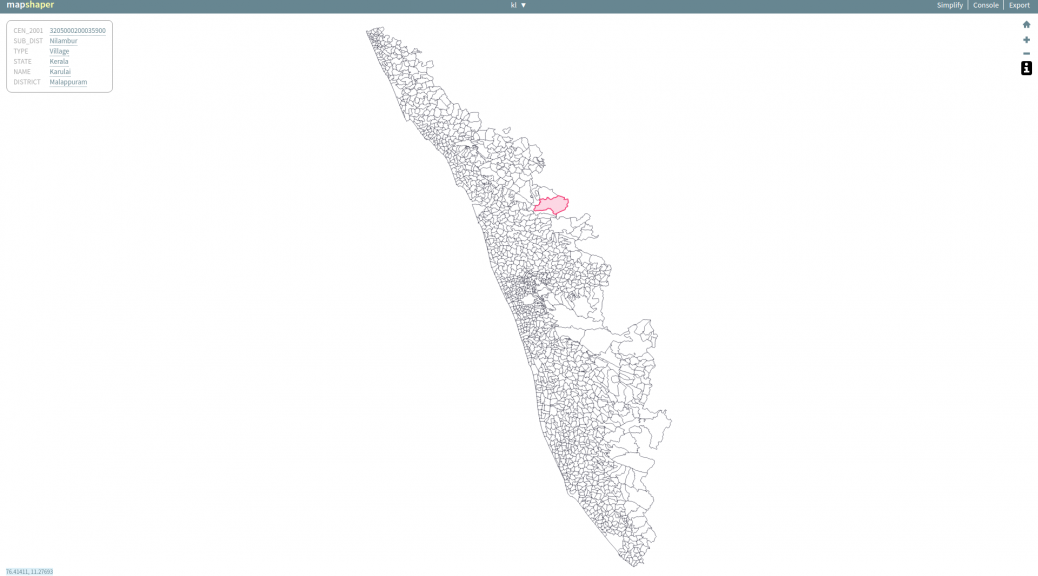
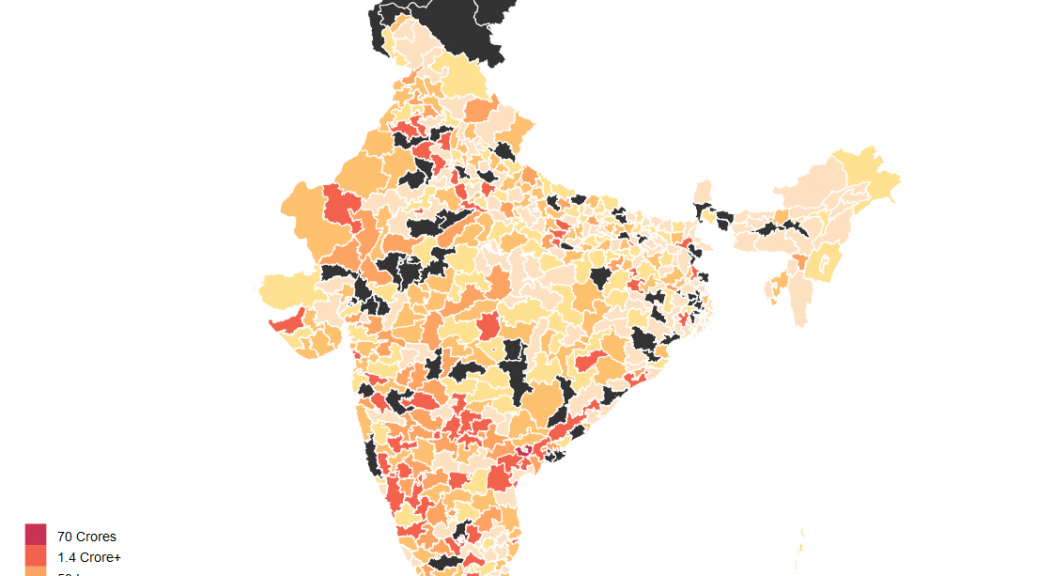
This data needs to be visualized on a map with boundaries showing every parliamentary contituency. Each constituency will indicate the number of criminal cases or assets of their respective MP using a difference in shading or color. Such visualizations are called choropleth maps. To my surprise, I couldn not find a map of Indian parliamentary constituencies from any direct or indirect government sources. That is when datameet came to my rescue. I found that DataMeet Bangalore had released such a shapefile. It is a 13.7MB file(.shp). Certainly not usable for a web project.

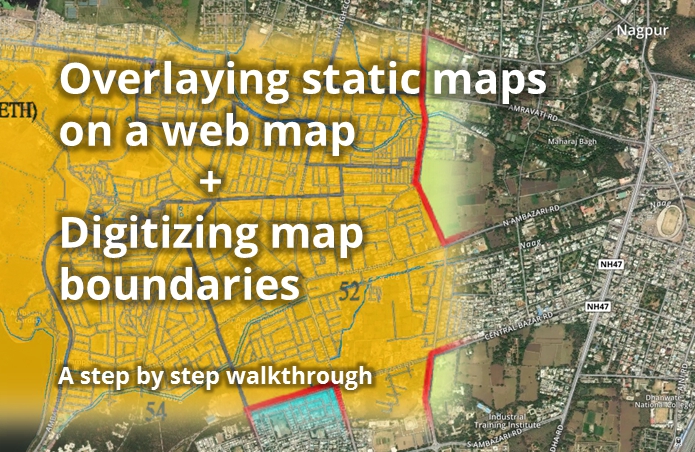
Next task would be somehow compress this shapefile to a small enough size that can be then used either as a standalone map or as an overlay on leaflet.js or Google Maps (or as I later learned Mapbox too).

From the beginning I was looking at d3.js to achieve this. The usual process to follow would be to convert the shapefile (.shp) into JSON format which D3 can use.

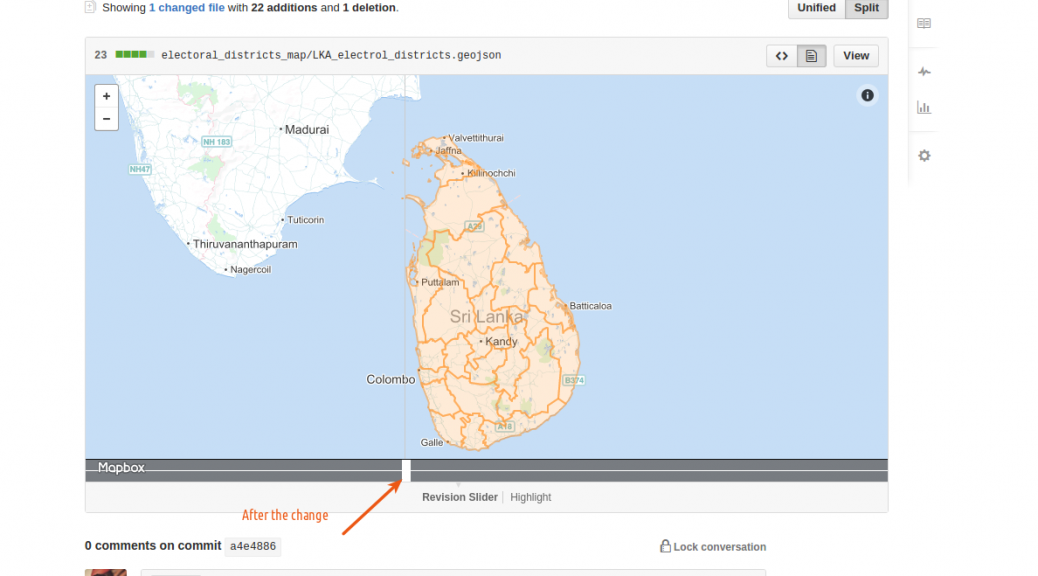
For map compression I found that Mike Bostock (a dataviz genius and also the person behind D3) has worked on a map format that does such compression, the format is called GeoJSON. After a bit of struggling with making things work on a Windows workstation and tweaking around with the default settings, I managed to bring the size down to 935 KB. Map was now ready for the web and I now had to only wade through D3 documentation to make the visualization.

Linking data with map and Visualization

Each parliamentary region in the GeoJSON file has a name tag which links it to the corresponding data values from dataset. A D3 script on the HTML page parses both and does this job to finally render this choropleth map.

The black regions on the maps are parliamentary contituencies that have alternate spellings. I could have used levenshtein distance to match them or more simply linked the map to data with a numeric ID. I’ll hopefully get that done someday soon.

link to project, github, map

Finally Looking at Data

The average member of parliment (only a few MPs have changed since 2015) has at least 1 criminal case against them, has a total asset value of about 14 Crore INR and has liabilities of value 1.4 Crore INR. But this dataset also has a lot of outliers so mean isn’t really the best representative of the central tendency. The median member of parliament has 0 criminal case against them, has total assets worth 3.2 Crore INR and has liabilities of value 11 Lakh INR.

The poorest member of parliament is Sumedha Nand Saraswati from Sikar who has total assets worth 34 thousand INR. Richest MP on the other hand is Jayadev Galla with declared assets of 683 Crore INR. Galla doesn’t directly fit the stereotypical corrupt politician meme with zero criminal cases against him. His wealth is best explained to the success of lead acid battery brand Amaron owned by the conglomerate his father founded in 1985.

Using OpenRefine to iron out spelling differences in data

OpenRefine is a powerful open source tool for working with messy data, made for non-coders. And just to stress on something I don’t want readers to miss,

made for non-coders.

It has a ton of features and I have not had the chance to use and learn the vast majority of them. But I learned one thing so I’m going to share that particular implementation: reconciling spelling differences in data.

Background

The data that I worked on: a few worksheets having bus stop names from BRT & Non BRT Route Details & Bus Stop LatLong.xls from Pune Open Data Portal.

I’ve written a detailed log of the whole (incomplete) exercise here, but I’ll expand on just the OpenRefine part. Apologies if any of this gets confusing.. just see the screenshots!

Steps

1. All the names that need reconciling are brought under one column. Other columns are kept to track serial numbers, etc. If two or more data tables are involved then a combined table is created carrying columns from all the tables, and one more column is made to disambiguate which sheet the row is from.

2. A copy column is made of this names column in the same table. Just in case we screw up and need to revert. Always make backups!

3. Save the file and load it up on OpenRefine. (assuming that you have downloaded, installed /extracted and started up OpenRefine and it is loaded on a tab in your browser)

4. Now we see the table laid out. There are drop-down arrow buttons on each column heading leading to menu of actions to do on that column. Locate the Names column you want to work on and open its menu.

5. First things first: clean up the cells by trimming leading and trailing whitespaces.openrefine trim spaces.png

clustering screenshot
note: names looking same are the reason why step 5 is important

6. Open the column’s menu again and choose Text facet > Clustering on the target column. It should open up something like below. (click the screenshot to see full size)

7. Consider first listing as example. ‘Pune Vidyapeeth Gate’ has 3 different spellings spanning 63 rows. If we click on one of the spellings, it appears under “New Cell Value”. We can even type a whole new spelling. Select the checkbox under “Merge?” and press the big button at bottom “Merge Selected & Re-Cluster”.

8. What happens in the background: The rest of the table stays as-is. But these 63 cells are over-written with the single new value.

9. So in two clicks we have done what normally would be a very long process in excel of filtering, sorting, copy-pasting and restoring to original order.

10. Here is a saved diff check on diffchecker.com that shows on left my original list and on right the normalized list I got through OpenRefine.

11. Do explore the various other options on the page. For bringing similar-spelling words together, certain linguistic algorithms are used (apologies but I haven’t bothered digging deeper into them), and there are multiple options, seen at the top of the last screenshot (“Method”, “Keying function”). Depending on your data one way may work better than the other. You can do one run of clustering / normalizing and then choose another algorithm that might cluster in another way. There will be false positives too (ie names that are supposed to be different only but the program thinks they should be same) and you can ignore them by keeping their “Merge?” checkbox off.

false positives and funny names screenshot
Bekar Company :P!

12. One more thing: This program works just as well on other languages. And it is particularly useful in catching all the cases where there’s confusion between choti ee maatra and badi ee maatra:

marathi names clustering
It does marathi names too!

Bus yaar

So that’s it for this walkthrough. Gratitude to DMer Aravind from Bangalore for insisting I check out this tool when I was saying “it’s ok I’m doing it in excel”. Have you used OpenRefine too? What was your application? Do share here or drop me an email on nikhil.js [at] gmail.com.

Links

PS: No, I’m not going to explain why in the world I was having a table of 40,000+ rows of bus stop names. It’s too traumatizing to share, please understand 😛

Making A Football Data Viz With D3 and Reveal.js

This is a write-up on how I made a slideshow for the Under-17 World Cup.

The U-17 World Cup is the first-ever FIFA tournament to be hosted by India. Like many of you, I’ve seen plenty of men’s World Cups, but never an U-17 one. To try and understand how the U-17 tournament might be different from the ‘senior’ version, I compared data from the last U-17 World Cup held in Chile in 2015 and the last men’s World Cup in Brazil in 2014.

The data was taken from Technical Study Group reports that are published by FIFA after every tournament. (The Technical Study Group is a mixture of ex-players, managers and officials associated with the game. You can read more about the group here.)

In particular, I used the reports for the 2014 World Cup and the 2015 U-17 World Cup. The data was taken pretty much as is, and thankfully didn’t have to be processed much. An example of the data available in the report can be seen in the image below. It shows how the 171 goals in the 2014 World Cup came about.

A look at some of the data in the report

The main takeaway from the comparison with the men’s World Cup is that the U-17 World Cup might see more goals and fewer 0-0 draws on average. The flipside is that there could be more cards and penalties too. For more details, check the slideshow.

BE LESS INTIMIDATING FOR READERS

I know just using one World Cup each to represent men’s and U-17 football may not be particularly rigorous. We could have also used data from the previous three or four World Cups in each age format. But if I did that, I was scared the data story would become more dense and intimidating for readers. I wanted to make this easy to follow along and understand, which is why I simplified things this way.

A card from the slideshow

Another thing I did to make this easier to digest was to stick to one main point per card (see image above). The main point is in the headline, then you get a few lines of text below showing how exactly you’ve arrived at the main point. The figures that have been calculated and compared are put in a bold font. Then there is an animated graphic below that, which visually reinforces the main point of the slide.

The data story tries to simulate a card format, one that you can just flick through on the mobile. I used the slideshow library reveal.js to make the cards. But I suspect there is a standard, more established method that mobile developers have to create a card format, will have to look into this further.

The animations were done with D3.js, with help from a lot of examples on stackoverflow and bl.ocks.org. If you’re new to D3 and want to know how these animations were done, here’s more info.

ANIMATING THE BAR CHART

The D3 ‘transitions’ or animations in this slideshow are basically the same. There’s (a) an initial state where there’s nothing to see, (b) the final state where the graphic looks the way you want and (c) a transition from the initial state to the final state over a duration specified in milliseconds.

A snippet of code for animating the bars

For example, in the code snippet for the bar animation above, you see two attributes changing for the bars during the transition—the ‘height’ and ‘y’ attributes changing over a duration of 500 milliseconds. You can see another example of this animation at bl.ocks.org here.

ANIMATING THE STACKED BAR CHART

This animation was done in a way similar to the one above. The chart is called a ‘normalised stack chart’ and the code for this was taken from the bl.ocks.org example here.

The thing about this chart is that you don’t have to calculate the percentages beforehand. You just feed in the raw data (see image below) and you get the final percentages visualised in the graphic.

The raw data on goals gets converted to percentages

ANIMATING THE LINE CHART

The transition over here isn’t very sophisticated. In this, the two lines and the data points on them are basically set to appear 300 milliseconds and 800 milliseconds respectively after the card appears on screen (see the code snippet below).

A snippet of code for changing the opacity of the line

A cooler line animation would have been ‘unrolling’ the line as seen in this bl.ock.org example. Maybe next time!

ANIMATING THE PIE CHART

Won’t pretend to understand the code used here. I basically just adapted this example from bl.ocks.org and played around with the parameters till it came out the way I wanted. This example is from Mike Bostock, the creator of D3.js, and in it he explains his code line by line (see image below). Do look at it if you want to fully understand how this pie chart animation works.

Commented code from Bostock

ANIMATING THE ISOTYPE CHART

Yup, this chart is called an isotype chart. This animation is another one where the transition uses delays. So if you look in the gif, you see on the left side three cards being filled one after the other.

Some of the code used in animating this isotype chart

They all start off with an opacity of 0, which makes them invisible (or transparent, technically). What the animation does is make each of the cards visible by changing the opacity to 1 (see image above). This is done after different delay periods of 200 milliseconds for the bottom card, 400 for the card in the middle and 600 milliseconds for the card on top.

FINAL WORD

If you’ve never worked with D3 before, hope this write-up encourages you to give it a shot. You can look at all the code for the slideshow in the github repo here. All comments and feedback are welcome! 🙂

COVER IMAGE CREDIT: Made in inkscape with this picture from Flickr

How to Make an Election Interactive

So I created an interactive for Wionews.com (embedded below) on the assembly elections taking place in five states. This write-up goes into how I did the interactive and the motivations behind it.


The Interactive is embedded below. Click on Start to begin.


The interactive looks at three things:

  • where each party won in the last assembly election in 2012 in each of the five states, visualised with a map.
  • where each party won in the last Lok Sabha (LS) election in 2014, if the LS seats were broken up into assembly seats. This was also done with a map.
  • the share of seats won by each major party in previous assembly elections, done with a line chart.

I got all my data from the Election commission website and the Datameet repositories, specifically the repositories with the assembly constituency shapefiles and historical assembly election results.

Now these files have a lot of information in them, but since I was making this interactive specifically for mobile screens and there wouldn’t be much space to play with, I made a decision to focus just on which party won where.

As mundane as that may seem, there’s still some interesting things you get to see. For example, from the break-up of the 2014 Lok Sabha results, you find out where the Aam Aadmi Party has gained influence in Punjab since the last assembly elections in 2012, when they weren’t around.

The interactive page on the AAP in Punjab, 2014

Contents

ANALYSING THE DATA

While I got the 2012 election results directly from the election commission’s files, the breakdown of the 2014 Lok Sabha results by assembly seat needed a little more work with some data analysis in python (see code below) and manual cross-checking with other election commission files.

Some of the python code used to break down the 2014 LS results by assembly seat.
Some of the python code used to break down the 2014 LS results by assembly seat. You can see all of it here.

For calculating the percentages of seats won by major parties in the past, I had to do some analysis in python of Datameet’s assembly election results file.

Some of the python code used to calculate historical seat shares of parties.
Some of the python code used to calculate historical seat shares of parties. You can see all of it here.

PUTTING IT ALL ONTO A MAP

The next thing to do was put the data of which party won where onto an assembly seat map for each state.

To get the assembly seat maps, I downloaded the assembly constituency shapefile from the datameet repository and used the software QGIS to create five separate shapefiles for each of the states. (Shapefiles are what geographers and cartographers use to make maps.)

A screenshot of the <a href="https://www.qgis.org" target="_blank">QGIS</a> software separating the India shapefile into separate ones for the states.
A screenshot of the QGIS software separating the India shapefile into separate ones for the states.

The next task is to make sure the assembly constituency names in the shapefiles match the constituency names in the election results. For example, in the shapefile, one constituency in Uttar Pradesh is spelt as Bishwavnathganj while in the election results, it’s spelt as Vishwanathganj. These spellings need to be made consistent for the map to work properly.

I did this with the OpenRefine software which has a lot of inbuilt tools to detect and correct these kinds of inconsistencies.

The purist way would have been to do all this with code, but I’ve been using OpenRefine, a graphical tool, for a while now and it’s just easier for me this way. Please don’t judge me! (Using graphical tools such as OpenRefine and QGIS make it harder for others to reproduce your exact results and is less transparent, which is why purists look down on a workflow that is not entirely in code.)

After the data was cleaned, I merged or ‘joined’ the 2012 and 2014 election results with the shapefile in QGIS, I then converted the shapefile into the geojson format, which is easier to visualise with javascript libraries such as D3.js.

I then chose the biggest three or four political parties in the 2012 assembly and 2014 LS election results for each state, and created icons for them using the tool Inkscape. This can be done by tracing the party symbols available in various election commission documents.

Some of the party icons designed for the interactive

HOW IT’S ALL VISUALISED

The way the interactive would work is if you click on the icon for a party, it downloads the geojson file which, to crudely put it, has the boundaries of the assembly seats and the names of the party that’s won each seat.

The interactive map showing the NPF in Manipur in 2014

You then get a map with the seats belonging to that party coloured in yellow. And each time you click on a different party icon, a new map is generated. (If I’ve understood the process wrong, do let me know in the comments!)

Here’s some of the d3 code used:

    map2
        .append("svg:image")  //put an image onto the canvas
        .attr("xlink:href","../exp_buttons/bharatiya_janta_party_75.png")  //take the image from the exp_buttons folder
        .attr('height', '75')
        .attr('width', '75')
        .attr('class','shadow partyButton')
        .attr('id','bjpButton')
        .attr("x", 30)             
        .attr("y", 0)    
        .on("click", function(){
            map
              .append("svg:g")         //create the map
              .style("fill","#4f504f")  //fill the map with this black color
              .selectAll("path")
              .data(json.features)
              .enter()
              .append("path")
                  .attr("d", pathx)
                  .style("stroke", "#fdd928")  //create yellow borders
                  .style("opacity","1")
                  .style("stroke-width", "1")
                  .style("fill",colorParty);      //colorparty is determined by the function below

		 //fill the seats with yellow if they were won by the “Bharatiya Janta Party”
		//and if they were won by someone else, make them black
					                
                function colorParty(d) {
                   if (d.properties.uttarakhand_2012_2012_1 == "Bharatiya Janta Party") {
                      return "#fdd928"
                } else {
                      return "#4f504f";
                    }
                };
              });

I won’t go into the nitty gritty of how the line chart works, but essentially every time you click on one of these icons, it changes the opacity of the line representing the party into 1 making it visible while the opacity of every other line is reduced to 0 making them invisible.

The historical performance of the MGP in Goa.

Here’s some of the relevant d3 code:

svg
	.append("svg:image")                                                             //this tells D3 to put an image onto the canvas
	.attr("xlink:href","../exp_buttons/bharatiya_janta_party_75.png")   //and this will be the bjp image located in the exp_buttons folder
	.attr('height', '75')
	.attr('width', '75')
	.attr('class','shadow partyButton')       //this is what gives a button the shadow, attributes derived from css 
	.attr('id','bjpButton')			     
	.attr("x", 0)             
	.attr("y", height + margin.top + 20)    
	.on("click", function(){
			d3.selectAll(".line:not(.bjpLine)").style("opacity", "0");  //make all other lines invisible
			d3.selectAll(".bjpLine").style("opacity", "1");                   //make the BJP line visible
			d3.select(this).classed({'shadow': false});		//remove the drop shadow from the BJP button 
											//so that people know it’s active
			d3.selectAll('.partyButton:not(#bjpButton)').classed({'shadow': true});  //this puts a drop shadow onto other buttons
													   //in case they were active
			
			});

I then put everything into a repository on Github and used Github pages to ‘serve’ the interactive to users.

Now I haven’t gone into the complexity of much of what’s been done. For example, if you see those party symbols and the tiny little shadows under them (they’re called drop shadows), it took me at least two days to make that happen.

It took two days to get these drop shadows!

MOTIVATIONS BEHIND THE INTERACTIVE

As for the design, I wanted something that people would just click/swipe through, that they wouldn’t have to scroll through, and also limit the data on display, giving only as much as someone can absorb at a glance.

My larger goal was to try and start doing data journalism that’s friendlier and more approachable than the stuff I’ve been doing in the past such as this blogpost on the Jharkhand elections.

I actually read a lot on user interface design, after which I made sure that the icons people tap on their screen are large enough for their thumbs, that icons were placed in the lower half of the screen so that their thumbs wouldn’t have to travel as much to tap on them, and adopted flat design with just a few drop shadows and not too many what-are-called skeumorphic effects.

Another goal was to allow readers to get to the information they’re most interested in without having to wade through paras of text by just tapping on various options.

The sets of options available to the user while in the interactive

I hacked a lot of D3.js examples on bl.ocks.org and stackoverflow.com to arrive at the final interactive, I’m still some way away from writing d3 code from scratch, but I hope to get there soon.

Because I’m not a designer, web developer, data scientist or a statistician, I may have violated lots of best practices in those fields. So if you happen to come across some noobie mistake, do let me know in the comments, I’m here to learn, thanks! 🙂


Shijith Kunhitty is a data journalist at WION and former deputy editor of IndiaSpend. He is an alumnus of Washington University, St. Louis and Hindu College, Delhi.

Guide on Digitizing Static Maps

I was recently invited to Nagpur by a group called Center for Peoples Collective, to brainstorm doing for Nagpur the kind of things I’ve done in Pune for budget data processing/viz and mapping. We found that they didn’t have any digital data (ie, shapefile, kml etc) of Nagpur’s electoral wards, but they did have some high-res images released by Nagpur Municipal Corporation (NMC) with the boundaries marked. So I walked them through a process that I’ve worked out, which uses free online services and doesn’t need any software or advanced skills to do. I’m sharing that process here.
Continue reading Guide on Digitizing Static Maps

Sikkim

#LATEPOST

Sikkim State Government passed an open data policy Sikkim Open Data Acquisition and Accessibility Policy in 2014. With pushing from the Chief Minister and Member of Parliament the Honorable Prem Das Rai they turned to open data to take control of the state’s data. The Honorable Mr PD Rai has repeatedly mentioned is the lack of access to government information on demand. It is not uncommon for lawmakers to ask questions only to have to wait a day or more for the answer and lose a moment to use that information for decision making.

An Open Data for Human Development Workshop was organized by the International Centre for Human Development of UNDP India, with the Centre for Internet and Society, AKVO, Mapbox and DataMeet co-facilitating the event in Bangalore last June. The aim was to bring together members of the Sikkim government, IT professionals, and open data enthusiasts.

20150416_124455

In April before the workshop Sumandro (CIS) and I went to Sikkim to have a pre consultation with the Sikkim government on how to prepare for the large workshop in Bangalore. We met with the MP and the heads of the Rural Development, Health, and IT departments to discuss their plans to implement their open data policy. Then there was a large meeting with all the departments and the MP. We presented different things you can do when data is opened and offered suggestions for how to implement the policy. 20150416_123613The departments took turns discussing their issues regarding implementation; concerns like server space, technology needs, how to create incentives to accurate and timely data uploading were shared.

We presented things for them to think about in a preparation for the June event and for how to work with the open data community in India.

In June the workshop was held as NIAS. Thej gave a session on data tools that can be used to assemble, clean, analyze, publish and visualize data. Some of the tools that he introduced and used during the workshop are

  • Tabula Its difficult to extract data from PDFs. But Tabula allows you to extract that data into a CSV or Microsoft Excel spreadsheet using a simple, easy-to-use interface. Tabula works on Mac, Windows and Linux.
  • Open Refine – is a powerful tool for working with messy data: cleaning it; transforming it from one format into another; extending it with web services; and linking it to databases like Freebase.
  • DataWrapper allows you to create powerful charts very easily.
  • CartoDB is the Easiest Way to Map and Analyze Your Location Data

“Overall interaction was great. Delegates from Sikkim were very interested in DataMeet community and work we do as community. Some part of the workshop was used to introduce the community aspect of Data.”

You can see the full notes of the event at Centre for Internet and Society’s blog.

We are looking forward to see Sikkim be the first state to implement an open data portal using the Data.Gov.In platform.

To Hack or Not to Hack….

Hackathons are a source of confusion and frustration for us. DataMeet actively does not do them unless there is a very specific outcome the community wants like freeing a whole dataset or introducing open data to a new audience. We feel that they cause burn out, are not productive, and in general don’t help create a healthy community of civic tech and open data enthusiasts.

That is not to say we feel others shouldn’t do them, they are very good opportunities to spark discussion and introduce new audiences to problems in the social sector. DataKind and RHOK and numerous others host hackathons or variations of them regularly to stir the pot, bring new people into civic tech and they can be successful starts to long term connections and experiments. A lot of people in the DataMeet community participate and enjoy hackathons.

However, with great data access comes great responsibility. We always want to make sure that even if no output is achieved when a dataset is opened at least no harm should be done.

Last October an open data hackathon, Urban Hack, run by Hacker Earth, NASSCOM, XEROX, IBM and World Resource Institute India wanted to bring out open data and spark innovation in the transport and crime space by making datasets from Bangalore Metropolitan Transport Corporation (BMTC) and the Bangalore City Police available to work with. A DataMeet member (Srinivas Kodali) was participating, he is a huge transport data enthusiast and wanted to take a look at what is being made available.

In the morning shortly after it started I received a call from him that there is a dataset that was made available that seems to be violating privacy and data security. We contacted the organizers and they took it down, later we realized it was quite a sensitive dataset and a few hundred people had already downloaded it. We were also distressed that they had not clarified ownership of data, license of data, and had linked to sources like Open Bangalore  without specifying licensing, which violated the license.

The organizers were quite noted and had been involved with hackathons before so it was a little distressing to see these mistakes being made. We were concerned that the government partners (who had not participated in these types of events before) were also being exposed to poor practices. As smart cities initiatives take over the Indian urban space, we began to realize that this is a mistake that shouldn’t happen again.

Along with Centre for Internet and Society and Random Hacks of Kindness we sent the organizers, Bangalore City Police and BMTC a letter about the breach in protocol. We wanted to make sure everyone was aware of the issues and that measures were taken to not repeat these mistakes.

You can see the letter here:

We are very proud of the DataMeet community and Srinivas for bringing this violation to the attention of the organizers. As people who participate in hackathons and other data events it is imperative that privacy and security are kept in mind at all times. In a space like India where a lot of these concepts are new to institutions, like the Government, it is essential that we are always using opportunities not only to showcase the power of open data but also good practices for protecting privacy and ensuring security.

Map of Electoral districts of Sri Lanka

SriLankan maps for Electoral districts are available for download now. I initially made this for a friend who wanted to analyze the election results. The Electoral districts are derived from the administrative maps.

via GIPHY

You can check the diff on github to see how the maps were changed.

GADM database of Global Administrative Areas is the source of administrative data. I used three simple online tools

  • GeoJSON.io for converting from KML to GeoJSON and adding attributes.
  • MapShaper for merging the areas
  • GitHub for storing the map files.

Note: I don’t provide any guarantee on the accuracy of the maps. So don’t use if you want accurate maps. I have made notes on how these maps were derived. Use it if you think the process is right. Raise an issue if you find anything.

Nepal Needs You to Make Maps!

Post by Tejas AP

The Humanitarian OpenStreetMap Team (HOTOSM) has activated to support crisis response in Nepal after the recent devastating earthquake. A global team of volunteers is contributing to the OSM project by mapping physical infrastructure (roads and buildings) as well as traces and areas safe for crisis responders to use and congregate at. We believe improved information, especially of the remote affected areas, is crucial to improve the efforts carried out by relief agencies on-ground.

Volunteers may contribute to the map of Nepal simply by selecting a task from the wiki. Basic questions about registering and using the OSM mapping tool can be found in its comprehensive documentation here.

While the volunteers have been recording road networks and buildings at a rapid pace, we understand that the communication networks in Nepal are still being restored, and crisis responders might not have access to navigation maps to expedite their efforts. We want to help in ensuring that people have access to map data in every manner possible.

We want to print offline maps and send them with relief materials from India to Nepal. Please help us by providing us

* a list of towns/villages/regions you need maps of, and

* point-of-contact we can deliver the printed maps to.

For more information, please get in touch with

Sajjad  – sajjad(at)mapbox(dot)com

Tejas  – tejaspande(at)live(dot)com

Nisha  – nisha(at)datameet(dot)com

Prabhas – prabhas.pokharel(at)gmail(dot)com

Meanwhile, here’s some information that you might find useful  –

1. https://www.mapbox.com/blog/nepal-earthquake/
2. The News Minute report –
http://www.thenewsminute.com/article/how-group-individuals-all-over-india-are-making-maps-help-rescue-teams-nepal
3. HOT Wiki – https://wiki.openstreetmap.org/wiki/2015_Nepal_earthquake
4. KLL report – http://kathmandulivinglabs.org/blog/