Category Archives: transportation

Using OpenRefine to iron out spelling differences in data

OpenRefine is a powerful open source tool for working with messy data, made for non-coders. And just to stress on something I don’t want readers to miss,

made for non-coders.

It has a ton of features and I have not had the chance to use and learn the vast majority of them. But I learned one thing so I’m going to share that particular implementation: reconciling spelling differences in data.

Background

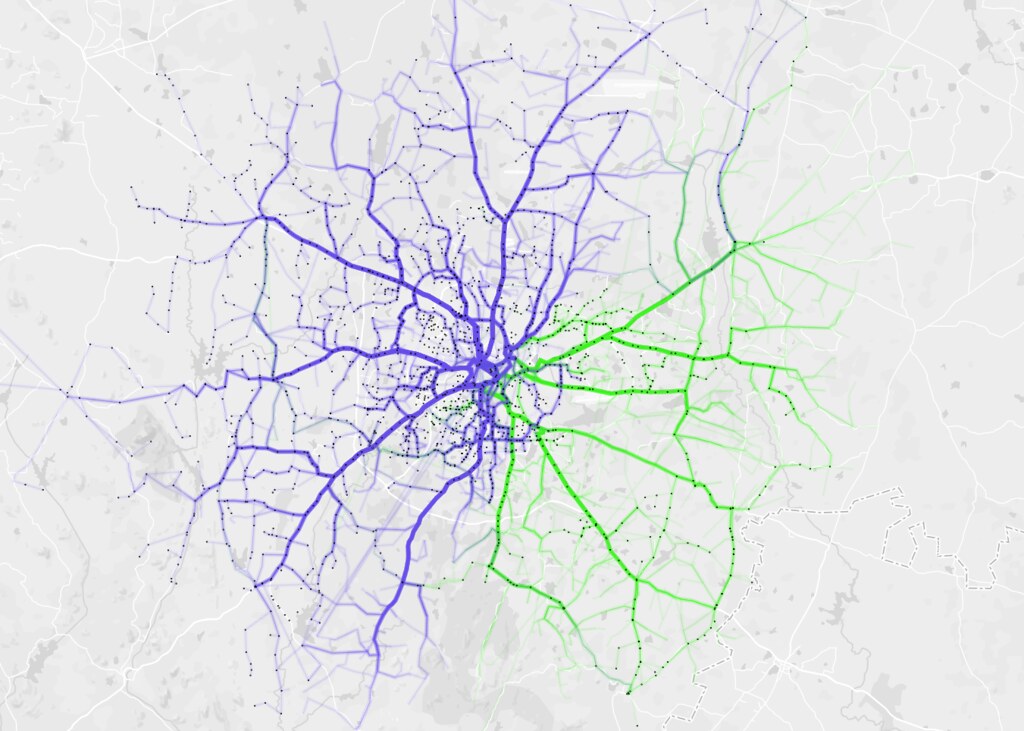
The data that I worked on: a few worksheets having bus stop names from BRT & Non BRT Route Details & Bus Stop LatLong.xls from Pune Open Data Portal.

I’ve written a detailed log of the whole (incomplete) exercise here, but I’ll expand on just the OpenRefine part. Apologies if any of this gets confusing.. just see the screenshots!

Steps

1. All the names that need reconciling are brought under one column. Other columns are kept to track serial numbers, etc. If two or more data tables are involved then a combined table is created carrying columns from all the tables, and one more column is made to disambiguate which sheet the row is from.

2. A copy column is made of this names column in the same table. Just in case we screw up and need to revert. Always make backups!

3. Save the file and load it up on OpenRefine. (assuming that you have downloaded, installed /extracted and started up OpenRefine and it is loaded on a tab in your browser)

4. Now we see the table laid out. There are drop-down arrow buttons on each column heading leading to menu of actions to do on that column. Locate the Names column you want to work on and open its menu.

5. First things first: clean up the cells by trimming leading and trailing whitespaces.openrefine trim spaces.png

clustering screenshot
note: names looking same are the reason why step 5 is important

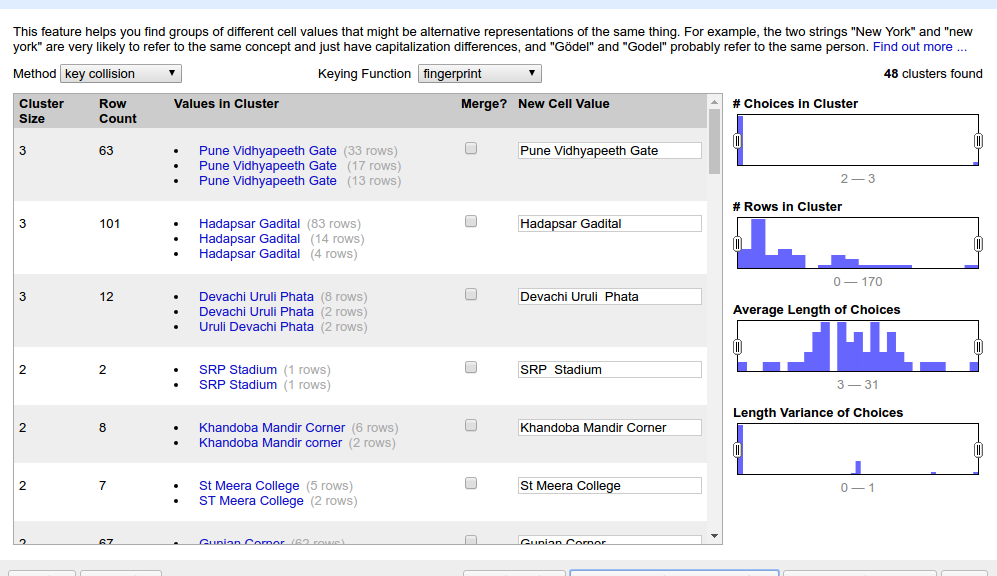
6. Open the column’s menu again and choose Text facet > Clustering on the target column. It should open up something like below. (click the screenshot to see full size)

7. Consider first listing as example. ‘Pune Vidyapeeth Gate’ has 3 different spellings spanning 63 rows. If we click on one of the spellings, it appears under “New Cell Value”. We can even type a whole new spelling. Select the checkbox under “Merge?” and press the big button at bottom “Merge Selected & Re-Cluster”.

8. What happens in the background: The rest of the table stays as-is. But these 63 cells are over-written with the single new value.

9. So in two clicks we have done what normally would be a very long process in excel of filtering, sorting, copy-pasting and restoring to original order.

10. Here is a saved diff check on diffchecker.com that shows on left my original list and on right the normalized list I got through OpenRefine.

11. Do explore the various other options on the page. For bringing similar-spelling words together, certain linguistic algorithms are used (apologies but I haven’t bothered digging deeper into them), and there are multiple options, seen at the top of the last screenshot (“Method”, “Keying function”). Depending on your data one way may work better than the other. You can do one run of clustering / normalizing and then choose another algorithm that might cluster in another way. There will be false positives too (ie names that are supposed to be different only but the program thinks they should be same) and you can ignore them by keeping their “Merge?” checkbox off.

false positives and funny names screenshot
Bekar Company :P!

12. One more thing: This program works just as well on other languages. And it is particularly useful in catching all the cases where there’s confusion between choti ee maatra and badi ee maatra:

marathi names clustering
It does marathi names too!

Bus yaar

So that’s it for this walkthrough. Gratitude to DMer Aravind from Bangalore for insisting I check out this tool when I was saying “it’s ok I’m doing it in excel”. Have you used OpenRefine too? What was your application? Do share here or drop me an email on nikhil.js [at] gmail.com.

Links

PS: No, I’m not going to explain why in the world I was having a table of 40,000+ rows of bus stop names. It’s too traumatizing to share, please understand 😛

BMTC Intelligent Transportation System (ITS) and need for Open Transport Data

Bangalore Metropolitan Transport Corporation (BMTC) has recently launched its Intelligent Transportation System (ITS) in May’16. First announced in 2013, this was one of the systems most data enthusiasts in urban transport were eagerly waiting for. The system was designed to scale on paper and BMTC made sure the data rights of data being generated are with them instead of the contractor. Even with extreme planning, the system was delayed by 2 years and has several issues with it. Some of these issues have been highlighted to BMTC by members of datameet’s transport working group with suggestions to make it better in early June.  Along with the suggestions we had several questions regarding the project, we have asked BMTC to help us understand the ITS system in a better way and expressed interest to be part of the Evaluation & Monitoring (E&M) of the ITS project.  It is important that the project is closely monitored to improve public transportation for Bengaluru.


We also shared some of the previous work carried out by members of the group and suggestions to use open transport standards like GTFS, usage of openstreetmap data to reduce maintenance costs for currently using third party services like Google Maps which is not entirely free.

Members of datameet have been working on transport data of BMTC since 2010. Thejesh GN hosts static data of routes and schedules  of various years through his project OpenBangalore.  As a community of researchers, data users and enthusiasts we have been studying and experimenting with the evolution of data practices in India. Open Data is helping us be aware of our surroundings and also contribute back to the city in our own way. BMTC’s ITS implementation is a opportunity for most of us, we can potentially use GPS data to understand traffic patterns, rash driving of bus drivers, skipping of bus stops and trips. The ITS system will help the commuters more than ever if being utilized the right way. Open Data can help make this dream a reality by letting any commuter analyze his ride. Officials of BMTC has made announcements of bringing up a data sharing policy on the lines of National Data Sharing and Accessibility Policy (NDSAP). In this regard we requested them to host a public consultation for their draft data sharing policy. We hope we can help BMTC and Bengaluru in a better way by bringing a policy suitable for all commuters and not just data users.


Analysing Bangalore’s Bus Network

Open Bangalore has been a pioneer in opening up several data sets that help understand Bangalore city. This includes the network of Bangalore Metropolitan Transport Corporation (BMTC). The BMTC operates over 2000 routes in the city and region of Bangalore and is the only real mode of public transit system in the city. Some of us at DataMeet took to time understand its network better by performing some basic analysis on the gathered dataset. The data set had bus stops, routes and trips. We inspected frequency, coverage, redundancy and reachability.

Longest route

BMTC is known for its many long routes. Route 600 is the longest, making a roundtrip around the city, covering 117 km in about 5 hours. There are 5 trips a day, and these buses are packed throughout. It should be noted that while the route traces the edges of the city in the west and north, it encircles the larger industrial clusters of the east and south.

View the map full screen.

Frequency

Next, I wanted to look at the frequency of different routes. In the image below, stroke thickness indicates how many trips each route makes. The relationship of the bus terminals with neighbourhoods and the road network can be easily observed. For instance, the north and west of the city have fewer, but more frequent routes. Whereas, the south has more routes with less frequency. Also, nodes in the north and west seem to rely more on the trunk roads than the diversely-connected nodes in the south. One can easily trace the Outer Ring Road, too.

View the map full screen.

Reachability

I tried to define reachability as destinations one can get to from a stop without transferring to another bus. The BMTC network operates long and direct routes. The map shows straight lines between bus stops that are connected by a single route. The furthest you can get is from Krishnarajendra Market (KR Market) to the eastward town of Biskuru: roughly 49 km as the crow flies.

View the map full screen.

Direction

Which directions does BMTC run? It is interesting that BMTC covers the city North – South (blue) and East – West (brown) with almost equal distribution.

View the map full screen.

Coverage

BMTC routes are classified into different series. Starting from 1 – 9 and A – W. I analysed coverage based on series 2 (blue) and 3 (green) and they make up almost 76% of the entire network.

View the map full screen.

Redundancy

Tejas and I took turns to try and figure out the redundancy within the network. Redundancy is good to absorb an over spill of bus commuters. Redundancy is a drain on resources and makes it hard to manage such a vast network with efficiency. So, we looked at segments that overlapped different bus routes.

View interactive map.

Node strength

This map by Aruna shows node strength – number of routes passing through a particular stop. You can see that the strength decreases as we move away from the city center with the exception of depots.

View interactive map.

Just like the data, our code and approach are open on Github. We would love to hear from you, and have conversations about the visualization, the BMTC, and everything in between!

To Hack or Not to Hack….

Hackathons are a source of confusion and frustration for us. DataMeet actively does not do them unless there is a very specific outcome the community wants like freeing a whole dataset or introducing open data to a new audience. We feel that they cause burn out, are not productive, and in general don’t help create a healthy community of civic tech and open data enthusiasts.

That is not to say we feel others shouldn’t do them, they are very good opportunities to spark discussion and introduce new audiences to problems in the social sector. DataKind and RHOK and numerous others host hackathons or variations of them regularly to stir the pot, bring new people into civic tech and they can be successful starts to long term connections and experiments. A lot of people in the DataMeet community participate and enjoy hackathons.

However, with great data access comes great responsibility. We always want to make sure that even if no output is achieved when a dataset is opened at least no harm should be done.

Last October an open data hackathon, Urban Hack, run by Hacker Earth, NASSCOM, XEROX, IBM and World Resource Institute India wanted to bring out open data and spark innovation in the transport and crime space by making datasets from Bangalore Metropolitan Transport Corporation (BMTC) and the Bangalore City Police available to work with. A DataMeet member (Srinivas Kodali) was participating, he is a huge transport data enthusiast and wanted to take a look at what is being made available.

In the morning shortly after it started I received a call from him that there is a dataset that was made available that seems to be violating privacy and data security. We contacted the organizers and they took it down, later we realized it was quite a sensitive dataset and a few hundred people had already downloaded it. We were also distressed that they had not clarified ownership of data, license of data, and had linked to sources like Open Bangalore  without specifying licensing, which violated the license.

The organizers were quite noted and had been involved with hackathons before so it was a little distressing to see these mistakes being made. We were concerned that the government partners (who had not participated in these types of events before) were also being exposed to poor practices. As smart cities initiatives take over the Indian urban space, we began to realize that this is a mistake that shouldn’t happen again.

Along with Centre for Internet and Society and Random Hacks of Kindness we sent the organizers, Bangalore City Police and BMTC a letter about the breach in protocol. We wanted to make sure everyone was aware of the issues and that measures were taken to not repeat these mistakes.

You can see the letter here:

We are very proud of the DataMeet community and Srinivas for bringing this violation to the attention of the organizers. As people who participate in hackathons and other data events it is imperative that privacy and security are kept in mind at all times. In a space like India where a lot of these concepts are new to institutions, like the Government, it is essential that we are always using opportunities not only to showcase the power of open data but also good practices for protecting privacy and ensuring security.

Open Transit Data for India

(Suvajit is a member of DataMeet’s Transportation working group, along with Srinivas Kodali, we are working on how to make more transit related data available.)

Mobility is one of the fundamental needs of humanity. And mobility with a shared mode of transport is undoubtedly the best from all quarters – socially, economically & environmentally. The key to effective shared mode of transport (termed as Public Transport) is “Information”. In India cities, lack of information has been cited as the primary reason for deterrence of Public Transport.

Transport Agencies are commissioning Intelligent Transport Systems (ITS) in various mode and capacity to make their system better and to meet the new transport challenges. Vehicle Tracking System, Electronic Ticketing Machines, Planning & Scheduling software are all engines of data creation. On the other side, advent of smart mobile devices in everyone’s hand is bringing in new opportunities to make people much more information reliant.

But the demand for transit data is remarkably low. The transit user and even transit data users like City Planners should demand for it.
The demand for Public Transport data in India should be for the following aspects:

A. Availability
To make operation and infrastructure data of Transport operators easily available as information to passengers in well defined order to plan their trip using available modes of Public Transport.

B. Interoperability
To make transit data provided by multiple agencies for different modes (bus, metro, rail) usable and make multi modal trip planning possible.

C. Usability
To publish transit oriented data in standard exchange format across agencies in regular frequencies to provide comprehensive, accurate and updated data for study, research, analysis, planning and system development.

D. Standardisation
To be a part of Passenger charter of Transport Operators to publish their data in standard format and frequency. This can also serve as a guideline for Transporter Operator while commissioning any system like Vehicle Tracking System, ITS, Passenger Information System, website etc.

What kind of Transit data is needed ?

  • Service Planning data

It will comprise of data on bus stops, stations, routes, geographic alignment, timetables, fare charts. With this dataset, general information on transit service can be easily gathered to plan a journey. Trip Planning mobile apps, portals etc can consume this data to provide ready and usable information for commuters.

  • Real time data

A commuter is driven by lot of anxieties when they depend on public transport mode. Some common queries; “When will the bus arrive ?”, “Where is my bus now?”, “Will I get a seat in the bus ?”, “Hope the bus has not deviated and not taking my bus stop.”.

Answer to all this queries can be attended via real time data like Estimated Time of Arrival (ETA), Position of the vehicle, Occupancy level , Alert and Diversion messages etc. Transport Operator equipped with Tracking systems should be able to provide these data.

  • Operational & Statistical Data

A Transport Operators operational data comprises of ticket sales, data of operation infrastructure and resources like Depots, Buses, Crew, Workshops etc. As operatore are tending towards digital mode of managing these data it also makes a good option to publish them at regular intervals.

A general commuter might not be interested in this data, but it will very useful for City Planners to analyse the trend of commute in the city and make informed decision. City transport infrastructure can be planned to orient it towards transit needs and demands.

The transport agency can benefit highly by demonstrating accountability and transparency. They can uplift their image as a committed service provider thereby gaining for passengers for their service.

So, together it will make a thriving landscape, if the data creators of Public Transport in India provide their data in Open which can be consumed by a larger set of people to build platforms, applications, solutions for transport study, analysis & planning across different section of users.

Open Transit Data is the tipping point for Smart Mobility in India.

That is why we have started putting our thoughts together and began writing an Open Transport Data Mainfesto.