All posts by Sajjad Anwar

Analysing Bangalore’s Bus Network

Open Bangalore has been a pioneer in opening up several data sets that help understand Bangalore city. This includes the network of Bangalore Metropolitan Transport Corporation (BMTC). The BMTC operates over 2000 routes in the city and region of Bangalore and is the only real mode of public transit system in the city. Some of us at DataMeet took to time understand its network better by performing some basic analysis on the gathered dataset. The data set had bus stops, routes and trips. We inspected frequency, coverage, redundancy and reachability.

Longest route

BMTC is known for its many long routes. Route 600 is the longest, making a roundtrip around the city, covering 117 km in about 5 hours. There are 5 trips a day, and these buses are packed throughout. It should be noted that while the route traces the edges of the city in the west and north, it encircles the larger industrial clusters of the east and south.

View the map full screen.

Frequency

Next, I wanted to look at the frequency of different routes. In the image below, stroke thickness indicates how many trips each route makes. The relationship of the bus terminals with neighbourhoods and the road network can be easily observed. For instance, the north and west of the city have fewer, but more frequent routes. Whereas, the south has more routes with less frequency. Also, nodes in the north and west seem to rely more on the trunk roads than the diversely-connected nodes in the south. One can easily trace the Outer Ring Road, too.

View the map full screen.

Reachability

I tried to define reachability as destinations one can get to from a stop without transferring to another bus. The BMTC network operates long and direct routes. The map shows straight lines between bus stops that are connected by a single route. The furthest you can get is from Krishnarajendra Market (KR Market) to the eastward town of Biskuru: roughly 49 km as the crow flies.

View the map full screen.

Direction

Which directions does BMTC run? It is interesting that BMTC covers the city North – South (blue) and East – West (brown) with almost equal distribution.

View the map full screen.

Coverage

BMTC routes are classified into different series. Starting from 1 – 9 and A – W. I analysed coverage based on series 2 (blue) and 3 (green) and they make up almost 76% of the entire network.

View the map full screen.

Redundancy

Tejas and I took turns to try and figure out the redundancy within the network. Redundancy is good to absorb an over spill of bus commuters. Redundancy is a drain on resources and makes it hard to manage such a vast network with efficiency. So, we looked at segments that overlapped different bus routes.

View interactive map.

Node strength

This map by Aruna shows node strength – number of routes passing through a particular stop. You can see that the strength decreases as we move away from the city center with the exception of depots.

View interactive map.

Just like the data, our code and approach are open on Github. We would love to hear from you, and have conversations about the visualization, the BMTC, and everything in between!

Latlong’s story of mapping India

The July edition of GeoBLR featured Rahul RS from Onze Technologies. Onze is the prefered store locator infrastructure by several businesses in India including TVS, Dell and Cafe Coffee Day. The store locator is powered by Onze’s very own Latlong.in – extensive, web based points of interest and map data interface.

2015-07-30 18.23.40

Rahul shared the story of Latlong.in, their infrastructure and challenges mapping Indian cities. They started out in 2007 at a time when there was no reasonable geographic data source available for India – commercial and non-commercial. Rahul’s team gathered toposheets from the Survey of India and georeferenced boundaries to incorporate into their maps. Rahul pointed out that these are inexpensive but high effort tasks. Plus, tools to do these are expensive.

In order to address India-specific mapping needs, geo-rectification needed to be inevitably supported by field surveys. Each city is unique and people entirely depend on landmarks and hyperlocal information to get around. Rahul brought in experts from different areas to gather local information. “The idea behind Latlong.in starts by saying that addresses don’t work in India”, says Rahul. When OpenStreetMap picked up, Latlong.in moved to a mix of their data and OSM that was maintained on their own. It is a complicated effort. Conflation and dealing with multiple revisions of data is tricky and there aren’t great tools to deal with it effortlessly. Latlong.in follows Survey of India’s National Map Policy. They avoid mapping defence and high security features.

Owning the entire data experience is critical to win in this market. Remaining open and improving continuously is the only way to keep your datasets upto date.

Francesca Recchia on Redressing Geopolitics

Among other goals this year for GeoBLR, we want to engage conversations that drift away from technical details of making maps and working with spatial data. In March, we featured Francesca Recchia to talk about geopolitics.

lbok

Francesca is an independent researcher and writer who has worked and taught in different parts of the world, including India, Iraq, Afghanistan, Pakistan, Palestine. She is interested in the geopolitical dimension of cultural processes and in recent years has focused her research on urban transformations and creative practices in countries in conflict.

Francesca spoke about her work in Kabul over the last two years around the Little Book of Kabul – exploring cultural practices by following Kabul’s own artists. Geographical and political borders and the construction of geopolitical imaginations have a profound impact on the way people think about and define themselves. She drew stories out of Mappa Mundi and Alighiero Boetti trying to connect how they reflect the geopolitical transformations of the world.

geoblr-francesca

Francesca says that the only way to understand politics and geopolitics and what this means for people in areas in conflict is to be amidst of it. This, she thinks is why one should work with artists and photographers.
Photos by Lorenzo Tugnoli

Olacabs at GeoBLR

Last week, we gathered at the Paradigm Shift cafe in Koramangala, to learn about the location data infrastructure at Olacabs.com. The meetup was particularly interesting in the light of Ola’s recent move adding autorickshaws to their offering. Location is at the center of Ola’s business.

Vijayaraghavan Amirisetty, Director of Engineering at Olacabs, introduced how they collect data in real-time from cars fitted with smartphones. With over a lakh vehicles online at any given time, Ola’s primary challenge is to build an infrastructure to allocate taxis to customers quickly and reliably. Vijay highlighted some of the issues around collecting location data via GPS and cell networks. Even though both the technologies have matured since their inception, they are highly unreliable in various scenarios. Ola uses a combination of algorithms to build a reliable layer over GPS and network. One thing to note is that the smartphones are of variable quality and the system needs to work regardless of these metrics.

olameetup

Even though Ola is using Google Play services as their location aggregator, in India, network is a bigger challenge. Quality varies from city to city and also reception within a city in unpredictable. Ola falls back to SMS, driver’s phone and a set of offline algorithms if the network is unavailable. Ola’s infrastructure is built using technologies like MongoDB, MySQL, Cassandra, Redis and Elastic Search. They are also exploring integrating web sockets and an experimental custom Android mod.

There was a lot of feedback from the audience specifically around why it is difficult for the drivers to locate the customer. Driver training is not an easy task – there are a lot of logistical and operational challenges. Vijay emphasised on the amount of work Ola does to improve the drivers’ experience with the whole process of on-boarding their cars.

Everything at Ola is realtime – why would anyone book an auto through Ola if they can just walk out and get one in less than a minute. They are continuing to improve and innovate to revolutionize transportation in Indian cities.

Autorickshaw photo CC 2.0 Spiros Vathis

GeoBLR in 2015 – Mapping Unmapped Places!

Dholera, Ahmedabad

To kick things off in 2015, we met at the offices of the Centre for Internet and Society (CIS), Bengaluru to map the unmapped/less-mapped settlements along the proposed Delhi-Mumbai Infrastructure Corridor (DMIC) project. The DMIC, a 1,483 km-long development corridor spanning several states in northern and western India, has been attracting a lot of curiosity and criticism from the national and international participants and observers. The project will have built a dedicated freight corridor, several industrial and logistics hubs, and smart cities at its completion. The project has been structured to be constructed in phases. The pilot project for an integrated smart city, Dholera Special Investment Region (SIR), is underway.

B61DDQzCUAACknX

The quality of mapping in many regions relies on a very active mapping community, or a strong interest from a collectives and local networks. We think it is important regardless to map the assets that pre-exist around the proposed sites of developments. With this in mind, we decided to take a look at the areas earmarked for the Dholera SIR (Gujarat), Shendra (Maharashtra), Mhow (Madhya Pradesh), and Dadri/ Greater Noida (NCR). The evening began with Tejas introducing the DMIC project, the scale of new development, and the need to capture these changes for years to come on OpenStreetMap (OSM). Sajjad provided a rapid tutorial on signing up for OSM, and using the browser-based map editor. The party was attended by guests at CIS as well as remotely from Bangalore and Dharamsala.

B61Hg57CIAAmBmV.jpg_large

As the party progressed, several guests ended up mapping roads, buildings, and water bodies in the Dholera region. Others chose to similarly map Shendra, and Dadri.

Rebuilding the Karnataka Learning Partnership Platform

The Karnataka Learning Partnership recently launched a new version of their platform. This post talks about why they are building this and also some of the features and details. This is cross-posted from their blog.

Over the past five months we have been busy rearchitecting our infrastructure at Karnataka Learning Partnership. Today, we are launching the beta version of the website and the API that powers most of it. There are still a few rough edges and incomplete features, but we think it is important to release early and get your feedback. We wanted to write this blog post along with the release to give you an overview of what has changed and some of the details of why we think this is a better way of doing it.

Data

We have a semi-federated database architecture. There is data from Akshara, Akshaya Patra, DISE and other partners; geographic data, aggregations and meta-data to help make sense of a lot of this. From our experience PostgreSQL is perhaps the most versatile open-source database management system out there, Especially when we have large amounts of geographic data. As part of this rewrite, we upgraded to PostgreSQL 9.3, which means better performance and new features.

Writing a web application which reads from multiple databases can be a difficult task. The trick is make sure that there is the right amount of cohesiveness. We are using Materialized Views in PostgreSQL. Materialized View is a database object that stores the result of a query in a on-disk table structure. They can be indexed separately and offer higher performance and flexibility compared to ordinary database views. We bring the data in multiple databases together using Materialized Views and refreshing them periodically.

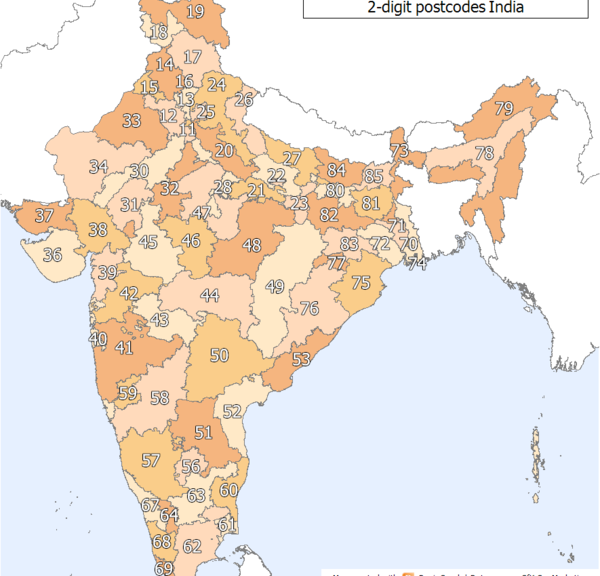
We have a few new datasets – MP/MLA geographic boundaries, PIN code boundaries and aggregations of various parameters for schools.

API

The majority of efforts during the rewrite went into making the API, user interface and experience. We started by writing down some background. The exhaustive list of things that the API can do are here.

We have a fairly strong Python background and it has proven to be sustainable at many levels. Considering the skill-sets of our team and our preference for readable, maintainable code, Django was an obvious choice as our back-end framework. Django is a popular web development framework for Python.

Since we were building a fairly extensive API including user authentication, etc., we quickly realized that it would be useful to use one of the many API frameworks built on top of Django. After some experimentation with a few different frameworks, we settled on using Django-Rest-Framework. Our aim was to build on a clean, RESTful API design, and the paradigms offered by Rest-Framework suited that perfectly. There was a bit of a learning curve to get used to concepts like Serializers, API Views, etc. that Rest-Framework provides, but we feel it has allowed us to accomplish a lot of complex behaviours while maintaining a clean, modular, readable code-base.

Design

For our front-end, we were working with the awesome folks at Uncommon, who provided us gorgeous templates to work with. After lengthy discussions and evaluating various front-end frameworks, we felt none of them quite suited what we were doing, and involved too much overhead. Most front-end frameworks are geared toward making Single Page Apps and while each of our individual pages have a fair amount of complexity, we did not want to convert everything into a giant single page app, as our experience has shown that can quickly lead to spiraling complexity, regardless of the frame-work one uses.

We decided to keep things simple and use basic modular Javascript concepts and techniques to provide a wrapper around the templates that Uncommon had provided and talk to our API to get and post data. This worked out pretty well, allowing us to keep various modules separated, re-use code provided by the design team as much as possible, and not have to spend additional hours and days fighting to fit our code into the conventions of a framework.
All code, design and architecture decisions are in the open, much like how rest of our organisation works. You can see the code and the activity log in our Github account.

Features

For the most part, this beta release attempts to duplicate what we had in v10.0 of the KLP website. However, there are a few new features and few features that have not yet made it through and a number of features and improvements due in future revisions.

Aside from the API, there are a few important new features worth exploring:

  1. The compare feature available at the school and pre-school level. This allows you to compare any two schools or pre-schools.

    1. Planned Improvements: The ability to compare at all and any levels of hierarchy; a block to a block or even a block to a district etc.

  2. The volunteer feature allows partner organisations to post volunteer opportunities and events at schools and pre-schools. It also allows users to sign up for such events.

    1. Planned Improvements: Richer volunteer and organisation profiles and social sharing options.

  3. The search box on the map now searches through school names, hierarchy (district, block etc.) names, elected representative constituency names and PIN Codes.

    1. Planned Improvements: To add neighbourhood and name based location search.

  4. An all new map page powered by our own tile server.

  5. Our raw data page is now powered by APIs and the data is always current unlike our previous version which had static CSV files.

    1. Planned Improvements: To add timestamps to the files and to provide more data sources for download.

Now that we have a fairly stable new code base for the KLP website, there are a few features from the old site that we still need to add:

  1. Assessment data and visualisations of class, school and hierarchy performance in learning assessments needs to be added. The reason we have chosen not to add it just yet is because we are modifying our assessment analysis and visualisation methodology to be simpler to understand.

  2. Detail pages for higher levels of aggregation – like a cluster, block and district with information aggregated to that level.

  3. A refresh of the KLP database to bring it up to date with the current academic year. All these three have not been done for the same reason; because this requires an exhaustive refactor of the existing database to support the new assessment schemas and aggregation and comparison logic.


Aside from the three above, we have a few more features that have been designed and written but did not make it in to the current release.

  1. Like the volunteer workflow, we have a donation workflow that allows partner organisations to post donation requirements on behalf of the schools and pre-schools they work with for things these schools and pre-schools require and other in-kind donations. For example, a school might want to set up a computer lab and requires a number of individual items to make it happen. Users can choose to donate either the entire lab or individual items and the partner organisation will help deal with the logistics of the donation.


Our next release is due mid-October to include the volunteer work flow and squish bugs. Post that, we will have a major release in mid-January with the refactored databases and all of the changes that it enables and all the planned improvements listed above. And yes, we do have a mobile application on our minds too.

The DISE application will be updated with the current years data as well by November. We will also add the ability to be able to compare any two schools or hierarchies by December.

So that’s where we are, four years on. The KLP model continues to grow and we now believe we have a robust base on which to rapidly build upon and deploy continuously.

For the record, this is version 11. 🙂

GeoBLR – PIN Code Extravaganza!

Last week at GeoBLR we discussed the issues around PIN codes. The most  important questions were around the processes the postal system and also what are the issues around the availability of reliable spatial data.

Couple of weeks back, Nisha and I started putting together several questions that we would like to get insights on. We used that as the starting point for the discussions. The meat of the problem really is that nobody knows what the processes are and how to get that information.

Prior to GeoBLR, we met some people who are interested in the same issue and clarified a lot of things – for instance, we are now sure that some times a single post office can deal with more than one PIN code.

To get a sense how people felt about the PIN codes issues, we asked around. Some people don’t bother to use PIN codes for any substantial service other than sending post cards.  As long as we are not able to tie PIN codes to geographic locations reliably, it’s not so useful.  Everybody agrees that it has immense potential just because it’s the only part of the address that everybody gets right (most of the time).

We also started to brainstorm how to come up with a plan so that a group like ours along with several other partners could work together to attempt to crowdsource the issue. Read more about the plan and next steps here!

20140821_191027 20140821_191035

The GeoBLR Sprint 1 – July 3, 6pm – 8pm

I’m excited to announce the first GeoBLR Sprint! The event is happening at The Center for Internet and Society on July 3, 6pm – 8pm. (RSVP)

During the July meetup, we are asking participants to bring their problems around maps and spatial data to the event. Some of Bangalore’s own data experts will be at the event, who will engage in a two hour problem solving exercise with the participants.

Have some map data that needs cleaning? Trouble with map projections or data formats? Looking for some data but not quite sure where to find it? Difficulty choosing colours for your map? May be we can help!

We encourage participants to get in touch with us prior to the event to talk about the issues that they would like to preset. Write to us on hello@geoblr.in, or post a comment on our Meetup group, or write to me (me at sajjad dot in). We will select couple of  challenging problems and will recommend solutions for others.

http://www.meetup.com/GeoBLR/events/190931712/

See you at the event!

[mapsmarker marker=”5″]


If you are curious to know more about GeoBLR and why we are doing it, I wrote about it here.