Tag Archives: education

DATA{MEET} PUNE, 5th Meetup – Roundtable

-article by Rasagy Sharma

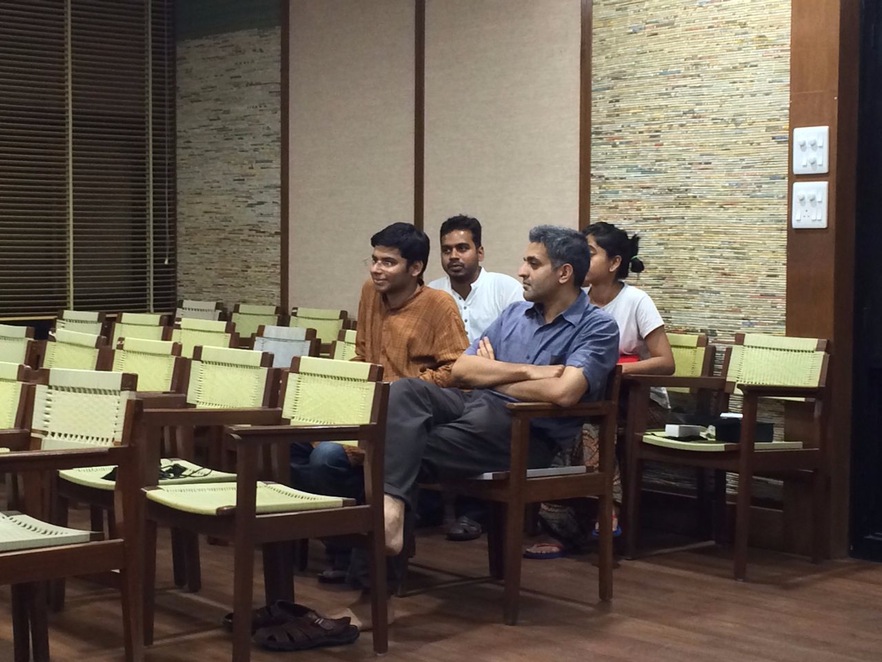
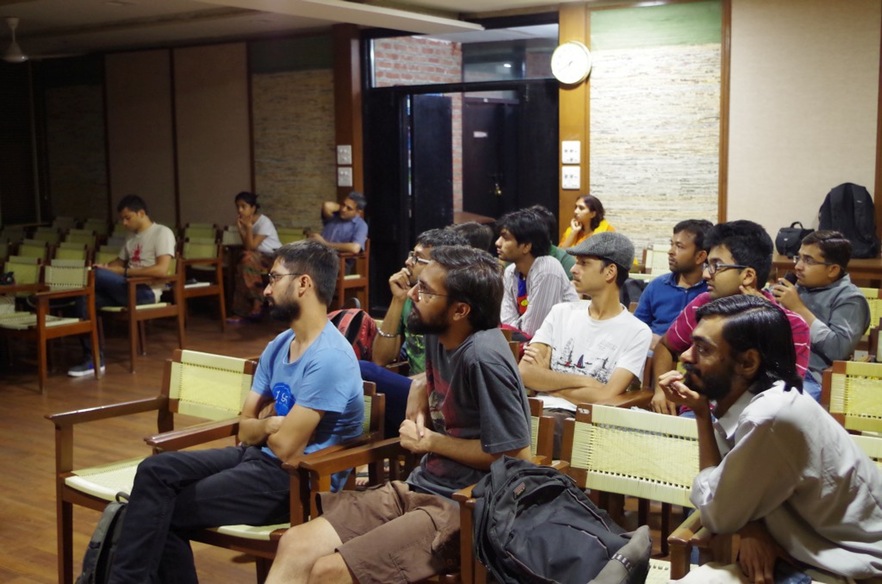
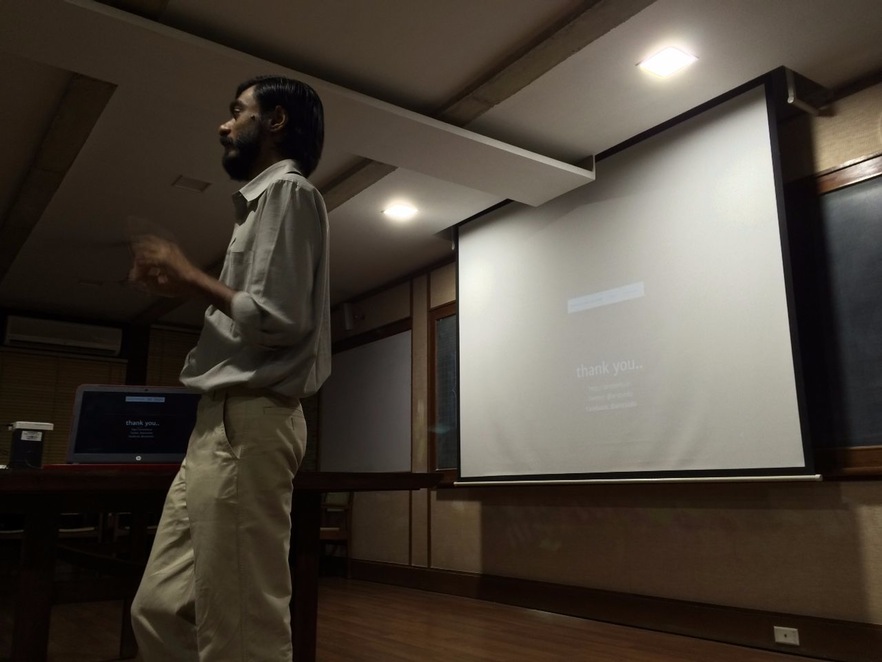
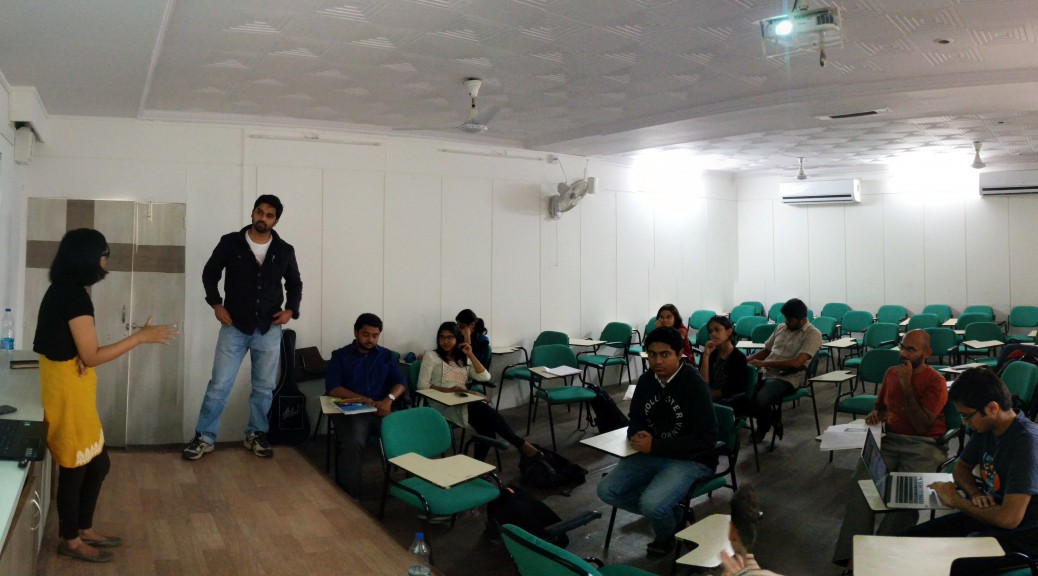
On the 16th of January, we hosted the fifth Datameet event for the Pune chapter at the Symbiosis School of Economics. The focus in this event was more on enabling discussions and initiating collaboration, so a Roundtable format was selected with three main speakers: Padmaja Pore from Door Step School, Jinda Sandbhor from Manthan Adhyayan Kendra and Nikhil VJ (Centre for Environment Education).

The session started with everyone introducing themselves. After that, Craig — co-organizer of the Pune chapter — talked about what Datameet is, how it started, and the aim of city chapters. He then explained how the Pune chapter is focused on connecting data-enthusiasts from various disciplines — such as NGOs, Data Analysts, Engineers and Designers — to help collaborate and spread more awareness about how data can be used.

Every Child Counts – Education of migrant children

The roundtable started with Padmaja Pore introducing Door Step School, an NGO that runs several projects around primary education. One such project is Every Child Counts (ECC) that was started in 2011 and focused on ensuring that  every child goes to school at the right age of 6-7 yrs. Through ECC, Door Step School seeks to understand and address barriers  to the schooling of kids of migrant communities such as those engaged in nomadic professions,workers at construction sites, factories, brick-kilns, etc. in the vicinity of Pune city.  When parents move their home several times in a year itself, how can it be ensured that their kids remain enrolled in schools?

In India, there are more than 1 million kids out of school (18 million in Southern Asia and 69 million globally). The Right to Education Act has ensured that free and compulsory education is available, but no systematic process of finding and enrolling out-of-school not been actively implemented, with no definite count of the number of migrant children denied education. Surveys have been focused on children already working/street children, whereas the need is to focus on children who are 6-7 years old so that they are enrolled into schools before they get drawn into employment. There have been no active steps to put in processes at schools for ensuring migrant children can transition smoothly to another school when they migrate. .

The ECC Project has the following Implementation Methodology, which is volunteer driven

1. Surveys: Volunteers conduct surveys of construction sites in partnership with NGOs
2.Preparatory camps: Through the medium of preparatory camps, awareness is spread amongst parents of children on the importance of schooling. After working with the children, the team realized that these kids are not aware about the concept of formal education, and are not used to sitting at one place for a few hours to study. Thus the focus in the preparatory camps is on interactive activities to get kids more accustomed to the environment.
3.Admission/ Enrollment: The children and parents are accompanied to a local public school and assisted with the enrolment process. Parents are made aware of the provisions of the RTE act.
4.Support and Follow-up: Arranging transport to school wherever needed, tracking attendance and addressing reasons for non-attendance

The ECC project is currently running in Pune, Pimpri Chinchwad, Fringe areas of Pune & Nasik. The project uses various types of data:

  • Unified DISE data on schools, which is comprehensive but lacks spatial aspect
  • Crowdsourced spatial data of public schools
  • Spatial data of construction sites – Both crowdsourced and taken from real estate portals & builders websites
  • Spatial mapping of volunteers in the field
  • Children at each construction sites, spotted by volunteers and NGO staff

Data sources: http://schoolreportcards.in/SRC-New/ & http://www.dise.in

Currently the data is collected using a mobile app based on ODK (Open Data Kit) & KoboToolbox/ONA. The team is developing a Web based Platform for scaling the ECC Program pan-India and engaging NGOs and CSR groups in this cause. One of the key features of this Website is envisaged to be to engage volunteers actively with children to help motivate, enroll and track their continuity for larger impact.

Challenges

Padmaja then talked about the way forward and the challenges they were facing w.r.t developing the ECC Platform as well as actually reaching all children in the project areas.

  • No formal source available for school locations, hence data is still partially incomplete and dependent on crowdsourcing of school locations.
  • Need a systematic way to predict locations of existing and future construction sites to find migrant labourers.Set up an ERP like system to record a child’s details, so they can be tracked after migration as well
  • Create a mobile friendly website for the Platform
  • Create more interactive maps and chart visualizations, showing schools, sites etc (heatmap or other suitable format) for providing an aggegation/ disaggregation of data on migrant children. This can help in advocacy efforts.
  • Explore ways to track migrated children Find ways to dynamically update the databases and see changes in map/chart visualizations after a volunteer makes an entry on the mobile survey form.

After the talk, everyone pooled in with their ideas and suggestions such as connecting with Trekking communities to pair up as volunteers to reach out to any schools/kids on the outskirts of the city, and collaborating with initiatives like Sagar Mitra (Recycling plastic). Few problems were taken up by individual attendees for further discussions, like finding ways to automate the data entry into excel which is done manually right now. Interested attendees were requested to volunteer and also reach out to their community to spread the word.

Village level Mapping

IMG-20160120-WA0000

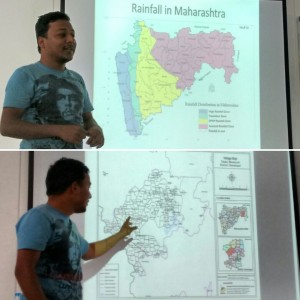
For the second talk, Jinda Sandbhor from Manthan Adhyayan Kendra spoke about village level mapping of tanker water supply in Maharashtra. With 14,708 drought affected villages in 2015 and 148 drought prone blocks, there is an immediate need for collecting data to analyze the reasons for drought and what can be done to better prepare for the future.

Most villages facing drinking water shortages due to lack of piped
water supply or lack of drinkable ground water. For such villages,
there is a tanker water supply from the Maharashtra government. The shortages are most severe just prior to and during the monsoon, some of these villages get return (North East) monsoons which reduces the demand of tankers by the end of the year. Jinda showed some aggregate data that has been collected that shows blockwise, the number of villages requesting the tanker supplies during
various months in the past few years.

There are multiple reasons for the demand of tankers:

  • Less rainfall & resulting drought is the main reason
  • Anthropogenic contamination of ground water
  • Dumping of mine water into the river

Challenges

Jinda highlighted his efforts to collect village specific data in some districts on the reason for request of the tanker. He mentioned that there is need for a village-level base map for Maharashtra that can help visualize and analyze this issue.
The discussions after this talk were focused on GIS related topics, with everyone agreeing for the need for detailed village level maps. While there are village level maps available in PDF as well as as a Web Map Service by Bhuvan, these need to be converted into shapefiles so they can be used for further analysis. This will enable visualizing with great accuracy, not just drought related data but any number of socio-economic parameters of Maharashtra for analysis.

It was also recommended to connect with Prof. Ashwini Chhatre from Indian School of Business (ISB) who has been working on Millets & Irrigation data and would have more detailed maps of the state. Another suggestion was to use GIS to take Land Revenue maps and convert into public-domain data.

Tools for participation in city governance

IMG-20160120-WA0001

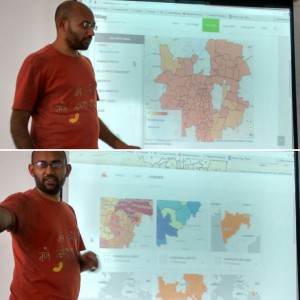
The third talk was by Nikhil VJ who is the co-organizer of the Pune Datameet chapter and has been working on multiple data-centric projects. He also showed his work on cleaning and mapping Pune’s Budget sheet, which was originally available as a 600 page PDF and now has been converted to excel and cleaned up considerably. The Pune Municipal Corporation has now agreed to bring in some reform in its budget book format and Nikhil & CEE are working on possible ways to take such tasks forward. Nikhil also covered several tools and methods described below that are easy for anyone to pick up and can help solve some interesting data-related problems.
Some of the resources mentioned by Nikhil were:
The newly launched website www.sahbhag.in — Participatory Urban Governance in Pune
nikhilvj.cartodb.com — Maps & Datasets of Pune posted online by Nikhil
www.crowdcrafting.org — Collecting & mapping of data with the power of crowdsourcing
Localizing Pune’s budget data by Nikhil & other volunteers:
http://crowdcrafting.org/project/localpunebudget
Map form — An experimental method that Nikhil has craeted to collect location data using WordPress plugins
www.mapwarper.net — Using maps that are currently as an image to wrap on
an actual map

With this, the session was formally concluded.
 

{Ahmedabad} – 2nd Meetup

Data{Meet} Ahmedabad – 2nd Meetup

Data{Meet} Ahmedabad - 2nd Meeting

Data{Meet} Ahmedabad – 2nd Meeting

Our 2nd meetup was held at IIM-A, under the aegis of the RTE Resource Centre, with 20 participants; half of them had attended the 1st meetup.

Talk #1: All walls come down – by Ashish Ranjan, RTE Resource Centre, IIM-A

The first talk in the 2nd DataMeet of Ahmedabad Chapter brought forward the efforts being put together by the team RTE, working out of IIM-Ahmedabad. The team members present at the venue were Prof. Ankur Sarin, Ashish Ranjan, Advaita R and Nishank Varshney. Ashish presented their journey of supporting the implementation of RTE in the state of Gujarat.

The Right to Education (RTE) act Section 12 requires schools to enrol a certain number of children from economically weaker families. The RTE Resource Centre (rterc.in) organises pre-enrolment campaigns for the benefit of prospective students and their parents, and has enlisted NGOs for hand-holding the children post-enrolment. The talk gave a glimpse of their experience in Ahmedabad, observations from Maharashtra, and the data-related challenges they faced.

datameet2

The management of this important activity was being done manually. This threw up many problems:
The registration of beneficiary families was often incomplete, with partial addresses – recording just the area of residence e.g. “Jamalpur”. This lead to many parents complaining about non-receipt of allotment letters..
There was no mapping of schools or beneficiary families, which could have aided better matching of children and schools.

A study by the team RTE revealed how a large number of schools were finding their way around the RTE mandate. These methods include making demands of un-required documentation of the parents to, tricking the MIS systems which enable applications from parents, into counting the ages of the children eligible for the schools as ineligible amongst various others. Nishank pitched in with instances from Maharashtra, where the minimum and maximum permissible age limits were deliberately entered by schools in such a way that potential students would be under age during an admission year, and over age the next year, effectively excluding them. In some particularly bad cases, the difference was one day: the child would have to be born on a specific date. For lack of efficient and transparent allotment processes, there were cases of candidates getting multiple admissions (as much as 18) while some did not get any. To bring out all these analyses, though, the school and student data from the Maharashtra RTE website had to be painstakingly downloaded, manually. Many DMers offered support to gather this data more easily.

datameet3

The team was quite inspired by the school map of the Karnataka Learning Partnership (klp.org.in/map) and wants to build such a comprehensive tool for themselves, with features to find schools within a specified distance, and help match students with schools. Unlike the Karnataka programme, there still is no MIS in place to facilitate the enrolment and selection process. Shravan suggested that it might be possible to use the codebase of KLP and adapt it for use in Ahmedabad. Hopefully, the D{M} folks will volunteer for the necessary support.

The RTE team also wants to build a tool to track the performance of enrolled students. They discussed about the potential privacy issues involved in this. It was suggested that the performance reporting to be published on the website could be at an appropriate level of aggregation which safeguards privacy and preserves discernible performance stats. The possibility of using ODK for volunteer led data collection was also discussed.
Getting together at the meetup opened up many possibilities for collaboration from the participants as a few of them came forward with suggestions and also extended their support to this cause.

Talk #2: Public Transport of Ahmedabad

Jayesh Gohel is not your everyday architect. He dropped out of his course at CEPT because he got too interested in code and soon enough he started enjoying making websites. Being an Amdavadi, he noticed the lack of infrastructure, both digital and non-digital in supporting the commuting that AMTS enabled in the city and so he decided to work on amtsinfo.in – the unofficial official support and information website for the Ahmedabad Municipal Transport Service.

Jaye

At the 2nd Datameet in Ahmedabad, Jayesh inspired the audience with his experiences with developing the website with the sole aim of solving the information problem related to the rather important and convenient network that AMTS is. Jayesh’s talk was simple and spoke about his personal motivations and learnings in the course of the development of this app. It also brought to the light the issues that plague the archaic systems that govern our modern lives, which can otherwise be so easily solved with the use of digital technology. However, ‘there’s hope if all of us take initiatives’, Jayesh said.

Rebuilding the Karnataka Learning Partnership Platform

The Karnataka Learning Partnership recently launched a new version of their platform. This post talks about why they are building this and also some of the features and details. This is cross-posted from their blog.

Over the past five months we have been busy rearchitecting our infrastructure at Karnataka Learning Partnership. Today, we are launching the beta version of the website and the API that powers most of it. There are still a few rough edges and incomplete features, but we think it is important to release early and get your feedback. We wanted to write this blog post along with the release to give you an overview of what has changed and some of the details of why we think this is a better way of doing it.

Data

We have a semi-federated database architecture. There is data from Akshara, Akshaya Patra, DISE and other partners; geographic data, aggregations and meta-data to help make sense of a lot of this. From our experience PostgreSQL is perhaps the most versatile open-source database management system out there, Especially when we have large amounts of geographic data. As part of this rewrite, we upgraded to PostgreSQL 9.3, which means better performance and new features.

Writing a web application which reads from multiple databases can be a difficult task. The trick is make sure that there is the right amount of cohesiveness. We are using Materialized Views in PostgreSQL. Materialized View is a database object that stores the result of a query in a on-disk table structure. They can be indexed separately and offer higher performance and flexibility compared to ordinary database views. We bring the data in multiple databases together using Materialized Views and refreshing them periodically.

We have a few new datasets – MP/MLA geographic boundaries, PIN code boundaries and aggregations of various parameters for schools.

API

The majority of efforts during the rewrite went into making the API, user interface and experience. We started by writing down some background. The exhaustive list of things that the API can do are here.

We have a fairly strong Python background and it has proven to be sustainable at many levels. Considering the skill-sets of our team and our preference for readable, maintainable code, Django was an obvious choice as our back-end framework. Django is a popular web development framework for Python.

Since we were building a fairly extensive API including user authentication, etc., we quickly realized that it would be useful to use one of the many API frameworks built on top of Django. After some experimentation with a few different frameworks, we settled on using Django-Rest-Framework. Our aim was to build on a clean, RESTful API design, and the paradigms offered by Rest-Framework suited that perfectly. There was a bit of a learning curve to get used to concepts like Serializers, API Views, etc. that Rest-Framework provides, but we feel it has allowed us to accomplish a lot of complex behaviours while maintaining a clean, modular, readable code-base.

Design

For our front-end, we were working with the awesome folks at Uncommon, who provided us gorgeous templates to work with. After lengthy discussions and evaluating various front-end frameworks, we felt none of them quite suited what we were doing, and involved too much overhead. Most front-end frameworks are geared toward making Single Page Apps and while each of our individual pages have a fair amount of complexity, we did not want to convert everything into a giant single page app, as our experience has shown that can quickly lead to spiraling complexity, regardless of the frame-work one uses.

We decided to keep things simple and use basic modular Javascript concepts and techniques to provide a wrapper around the templates that Uncommon had provided and talk to our API to get and post data. This worked out pretty well, allowing us to keep various modules separated, re-use code provided by the design team as much as possible, and not have to spend additional hours and days fighting to fit our code into the conventions of a framework.
All code, design and architecture decisions are in the open, much like how rest of our organisation works. You can see the code and the activity log in our Github account.

Features

For the most part, this beta release attempts to duplicate what we had in v10.0 of the KLP website. However, there are a few new features and few features that have not yet made it through and a number of features and improvements due in future revisions.

Aside from the API, there are a few important new features worth exploring:

  1. The compare feature available at the school and pre-school level. This allows you to compare any two schools or pre-schools.

    1. Planned Improvements: The ability to compare at all and any levels of hierarchy; a block to a block or even a block to a district etc.

  2. The volunteer feature allows partner organisations to post volunteer opportunities and events at schools and pre-schools. It also allows users to sign up for such events.

    1. Planned Improvements: Richer volunteer and organisation profiles and social sharing options.

  3. The search box on the map now searches through school names, hierarchy (district, block etc.) names, elected representative constituency names and PIN Codes.

    1. Planned Improvements: To add neighbourhood and name based location search.

  4. An all new map page powered by our own tile server.

  5. Our raw data page is now powered by APIs and the data is always current unlike our previous version which had static CSV files.

    1. Planned Improvements: To add timestamps to the files and to provide more data sources for download.

Now that we have a fairly stable new code base for the KLP website, there are a few features from the old site that we still need to add:

  1. Assessment data and visualisations of class, school and hierarchy performance in learning assessments needs to be added. The reason we have chosen not to add it just yet is because we are modifying our assessment analysis and visualisation methodology to be simpler to understand.

  2. Detail pages for higher levels of aggregation – like a cluster, block and district with information aggregated to that level.

  3. A refresh of the KLP database to bring it up to date with the current academic year. All these three have not been done for the same reason; because this requires an exhaustive refactor of the existing database to support the new assessment schemas and aggregation and comparison logic.


Aside from the three above, we have a few more features that have been designed and written but did not make it in to the current release.

  1. Like the volunteer workflow, we have a donation workflow that allows partner organisations to post donation requirements on behalf of the schools and pre-schools they work with for things these schools and pre-schools require and other in-kind donations. For example, a school might want to set up a computer lab and requires a number of individual items to make it happen. Users can choose to donate either the entire lab or individual items and the partner organisation will help deal with the logistics of the donation.


Our next release is due mid-October to include the volunteer work flow and squish bugs. Post that, we will have a major release in mid-January with the refactored databases and all of the changes that it enables and all the planned improvements listed above. And yes, we do have a mobile application on our minds too.

The DISE application will be updated with the current years data as well by November. We will also add the ability to be able to compare any two schools or hierarchies by December.

So that’s where we are, four years on. The KLP model continues to grow and we now believe we have a robust base on which to rapidly build upon and deploy continuously.

For the record, this is version 11. 🙂