Tag Archives: Pune

DATA{MEET} PUNE, 5th Meetup – Roundtable

-article by Rasagy Sharma

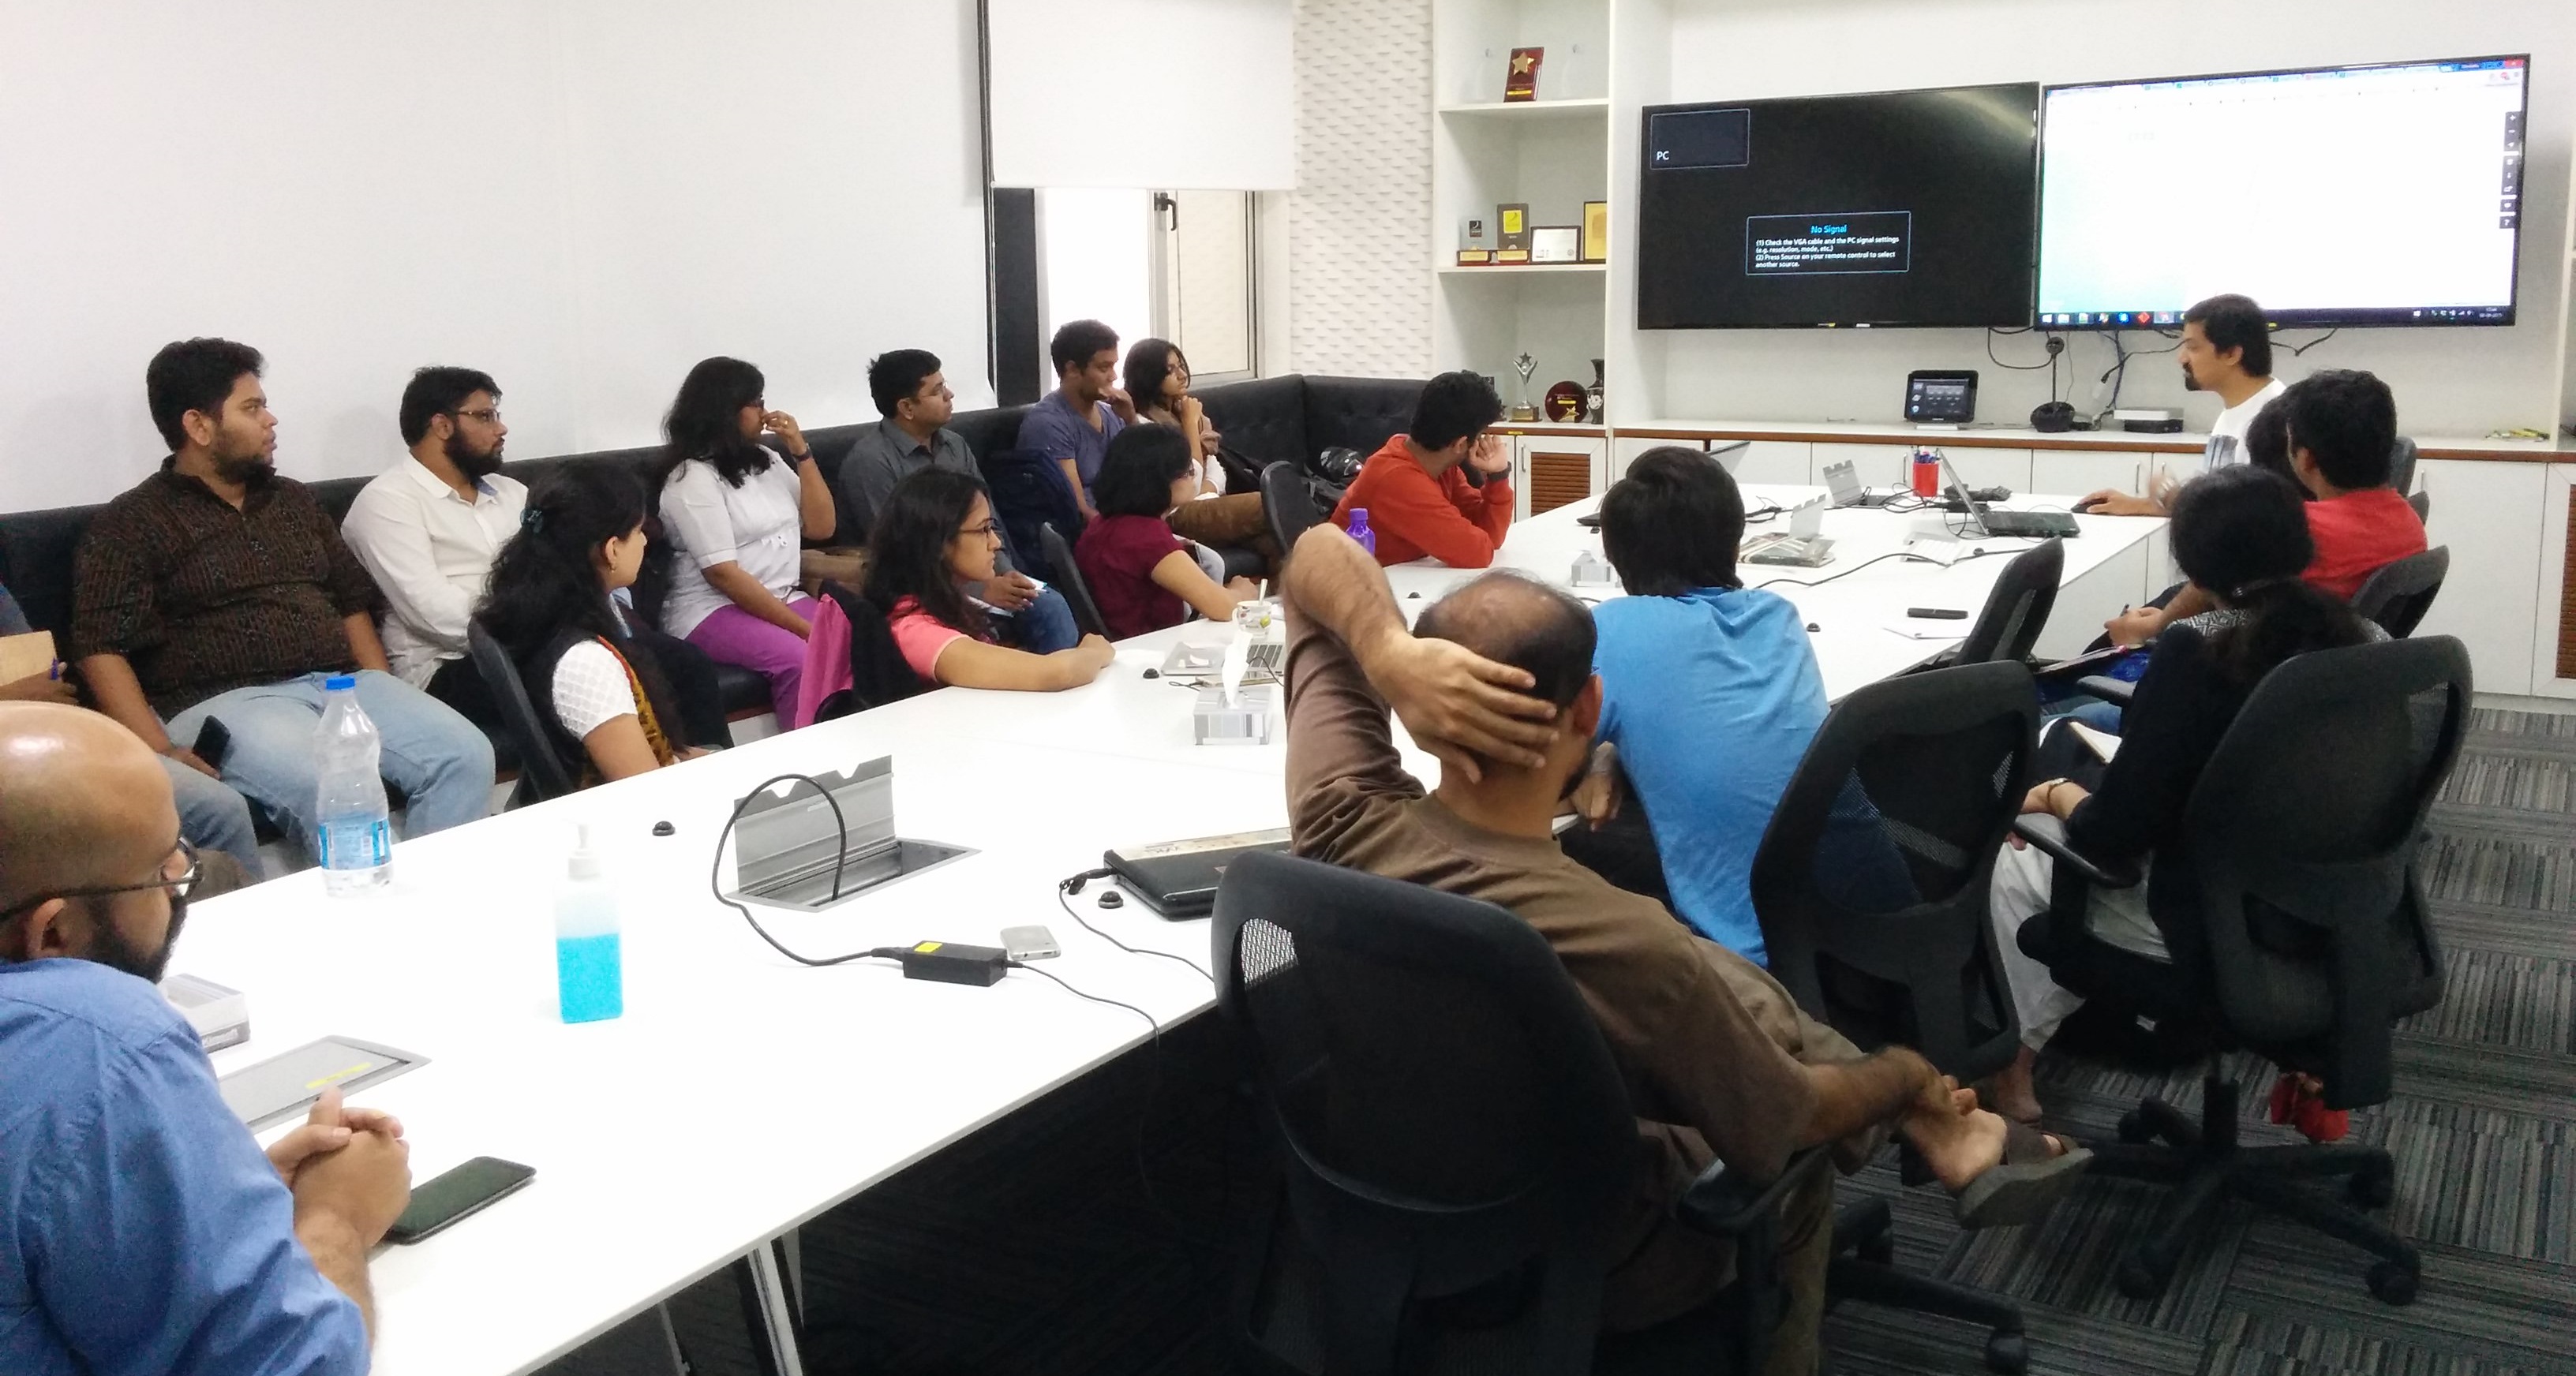
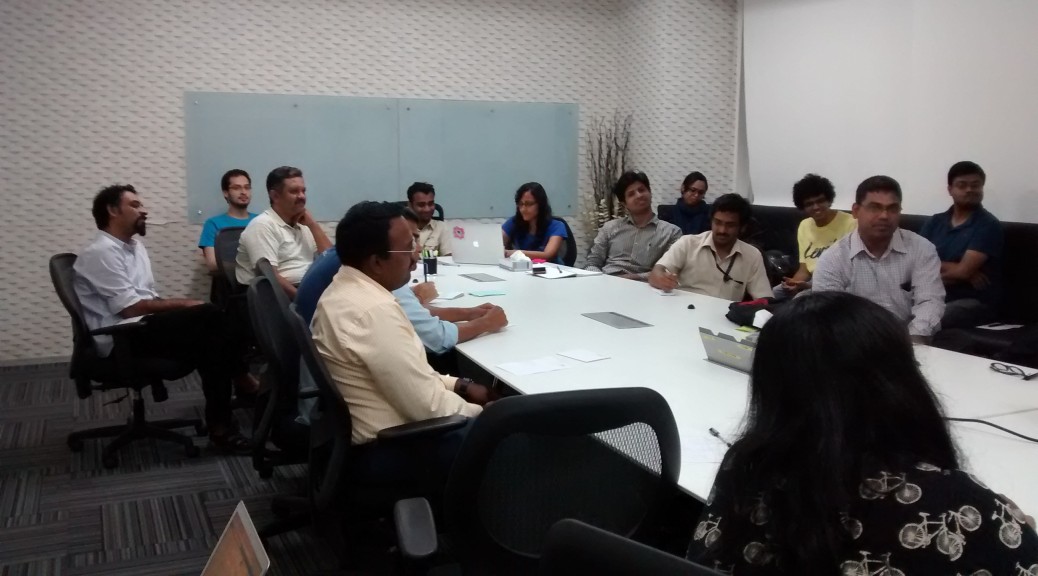
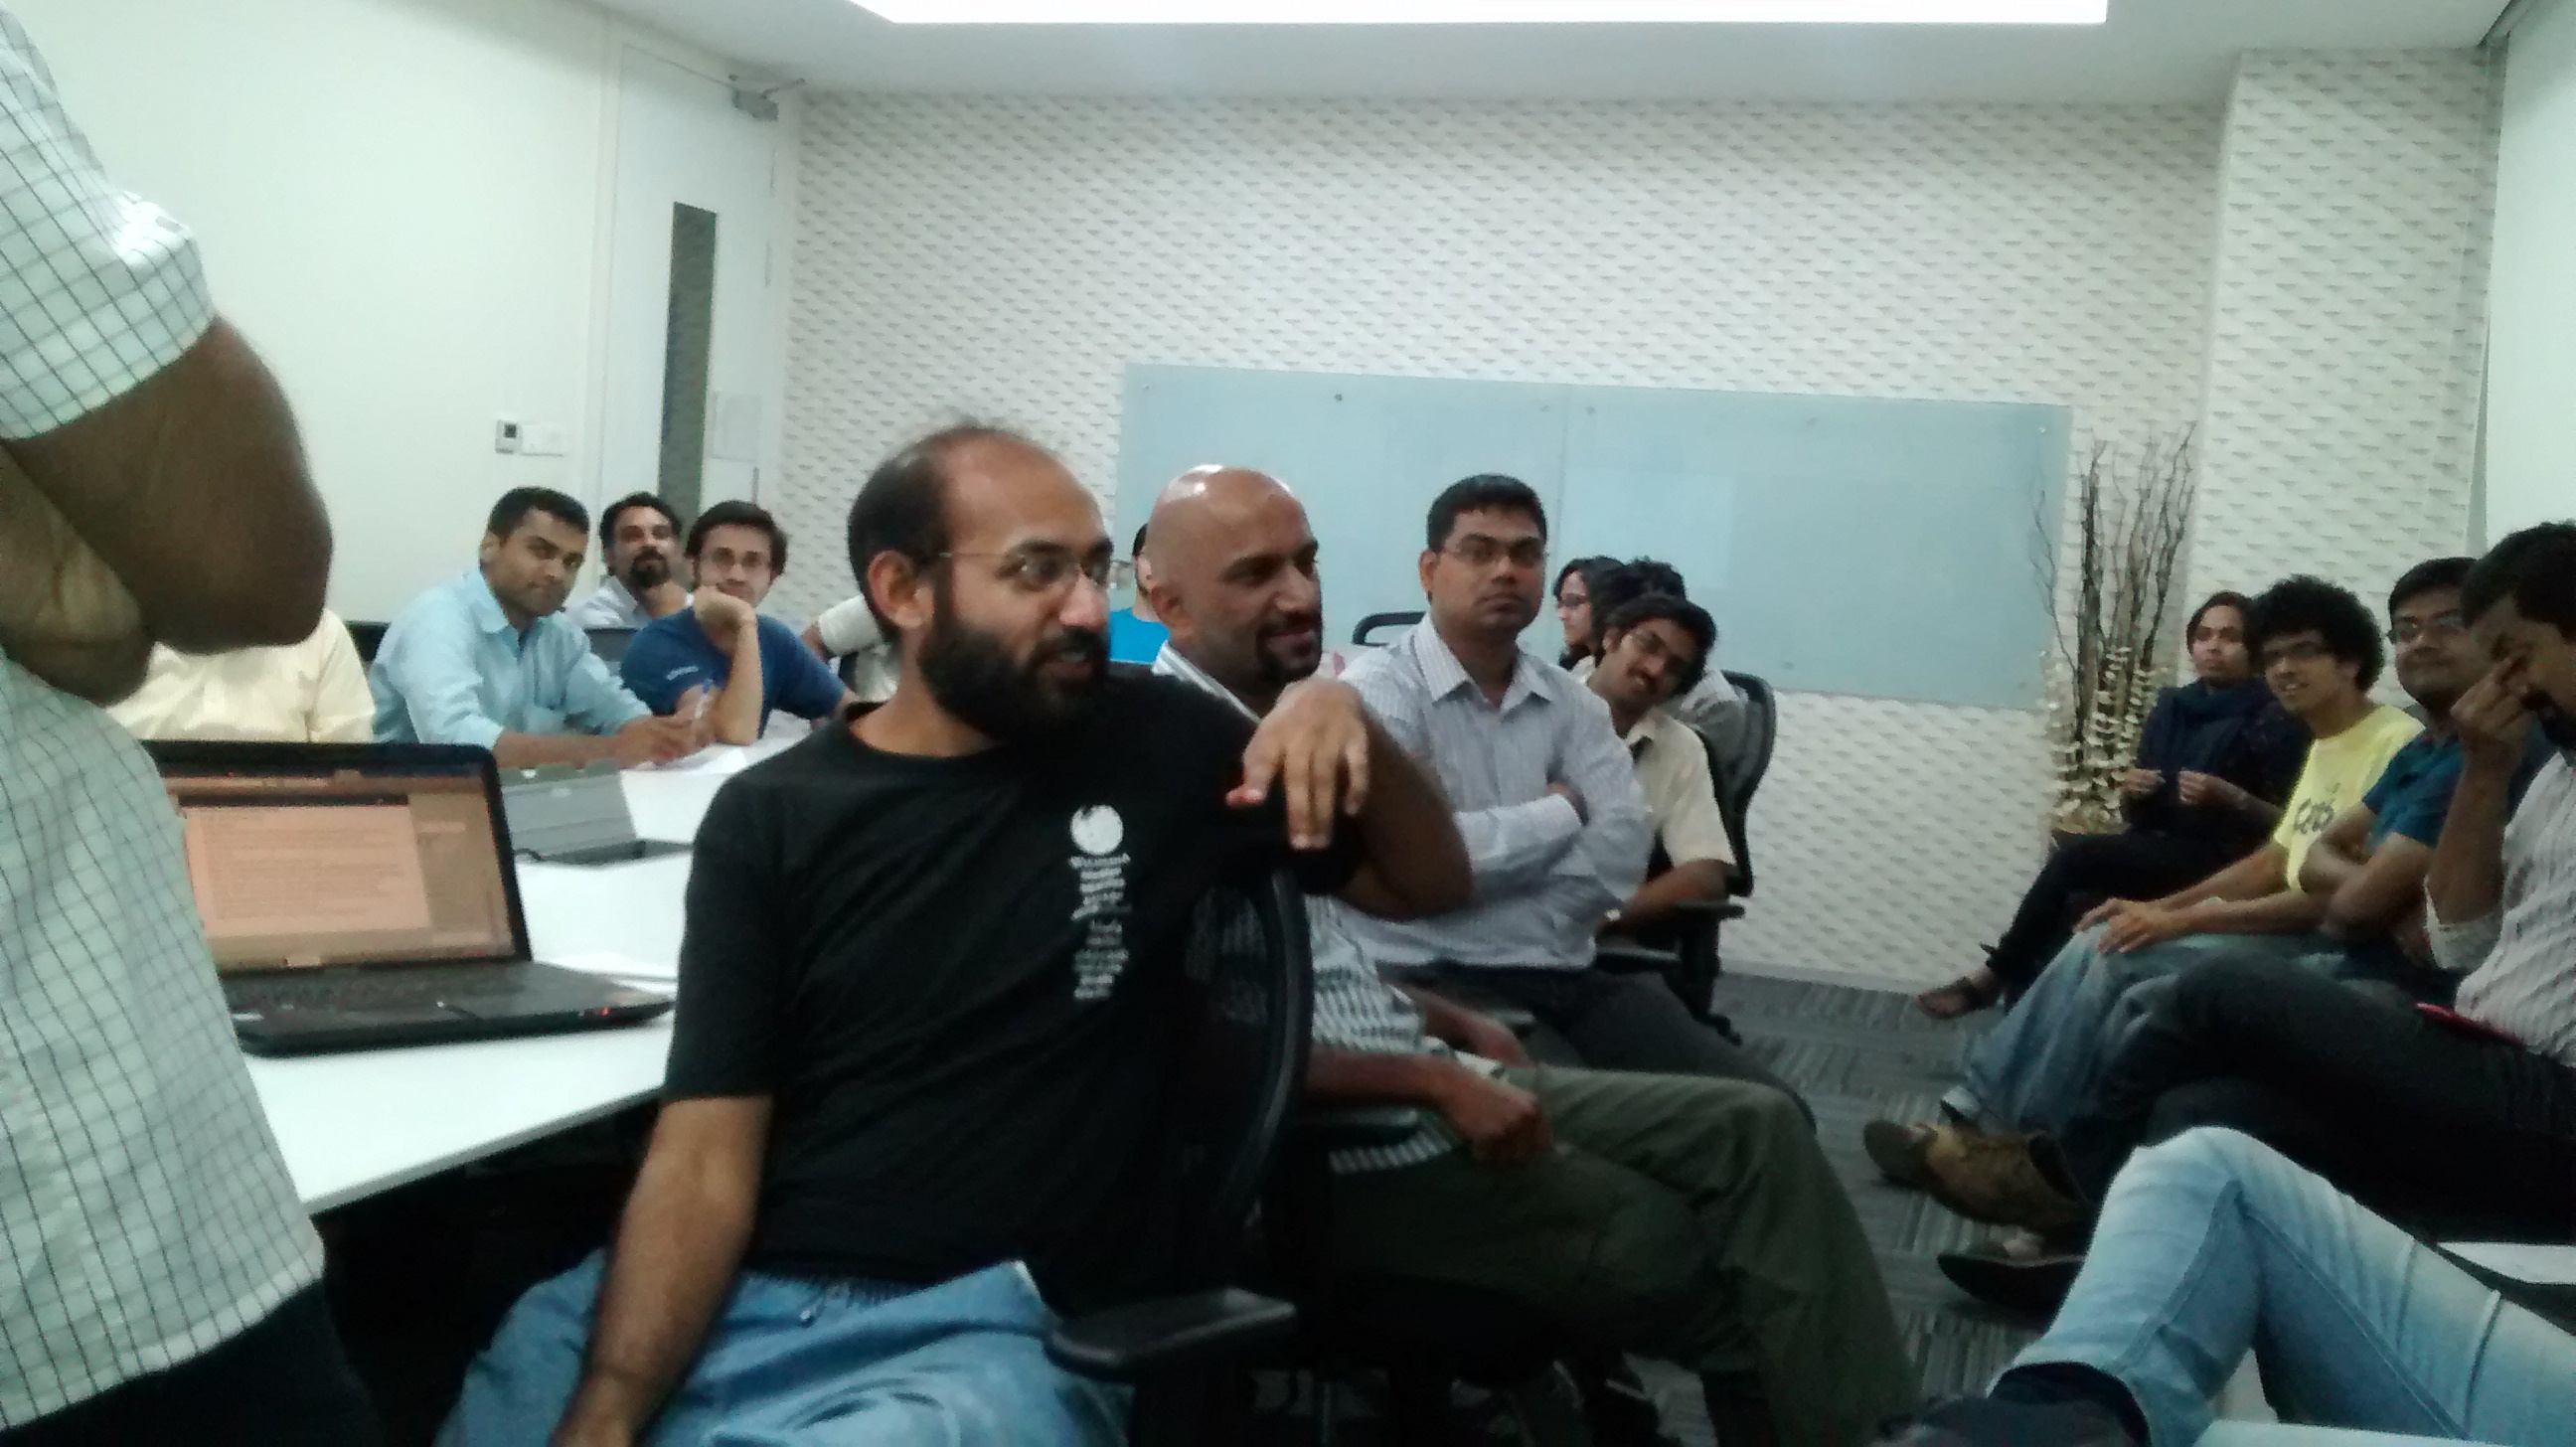
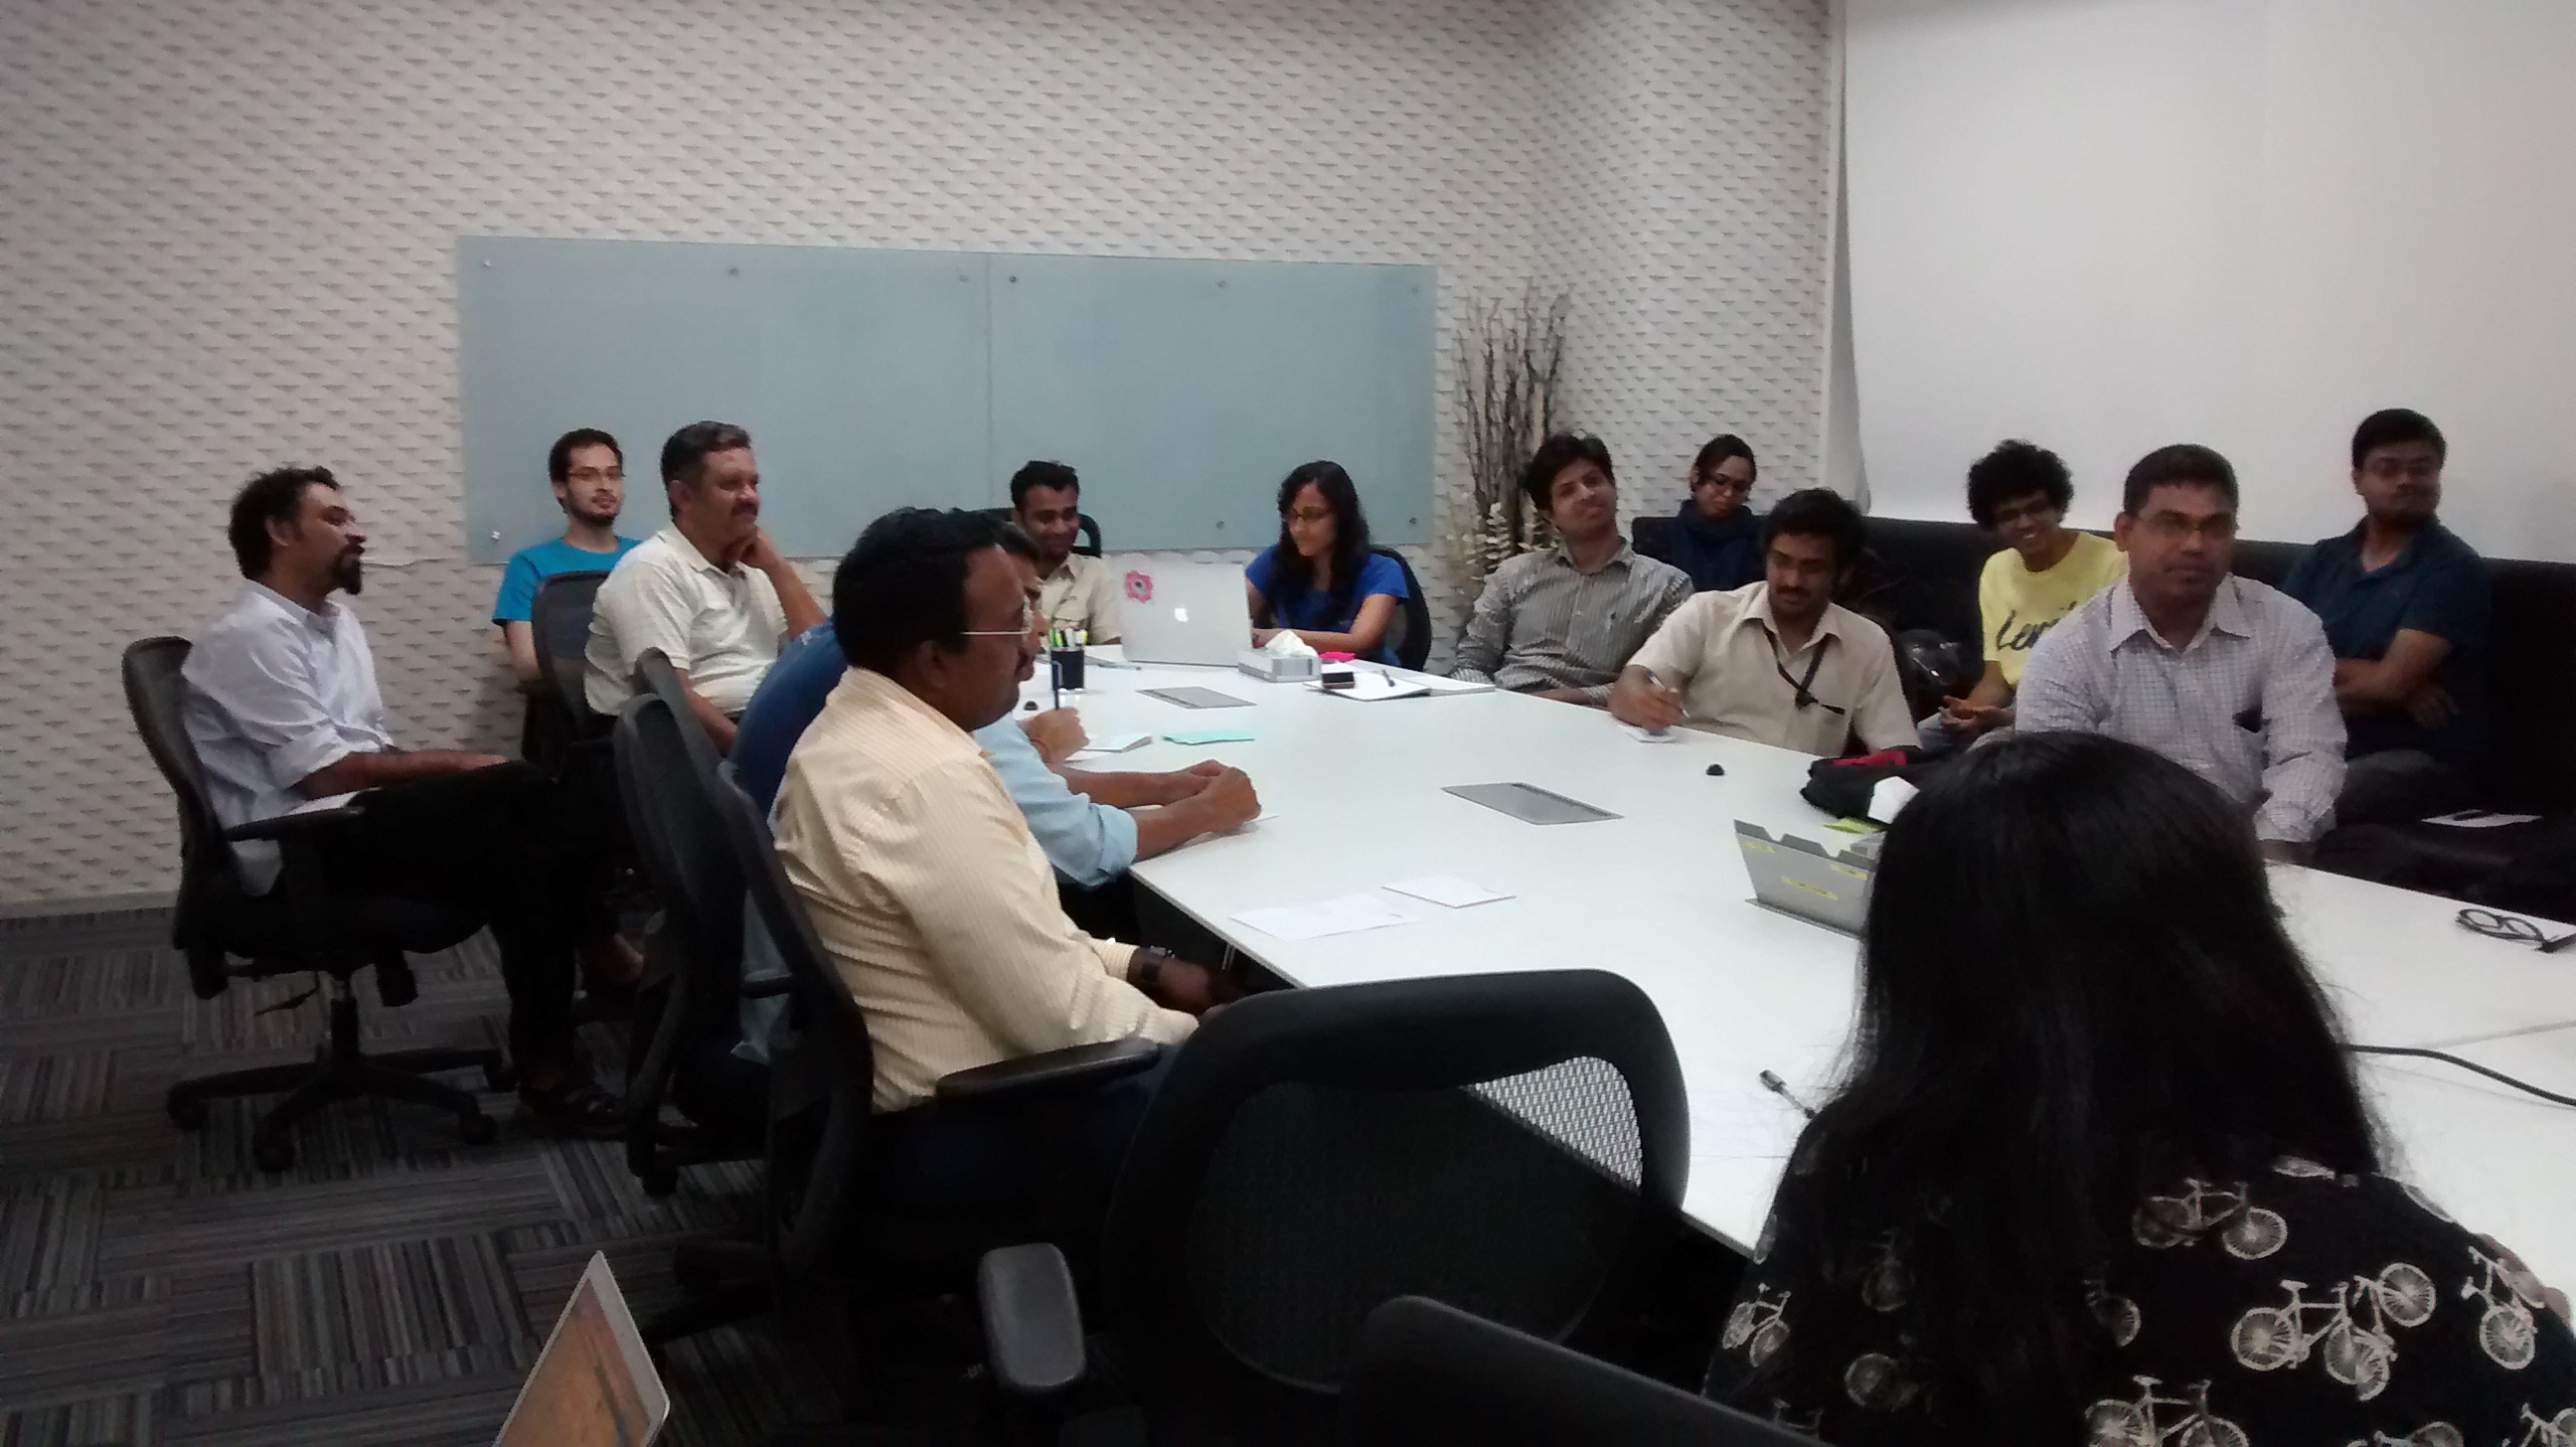
On the 16th of January, we hosted the fifth Datameet event for the Pune chapter at the Symbiosis School of Economics. The focus in this event was more on enabling discussions and initiating collaboration, so a Roundtable format was selected with three main speakers: Padmaja Pore from Door Step School, Jinda Sandbhor from Manthan Adhyayan Kendra and Nikhil VJ (Centre for Environment Education).

The session started with everyone introducing themselves. After that, Craig — co-organizer of the Pune chapter — talked about what Datameet is, how it started, and the aim of city chapters. He then explained how the Pune chapter is focused on connecting data-enthusiasts from various disciplines — such as NGOs, Data Analysts, Engineers and Designers — to help collaborate and spread more awareness about how data can be used.

Every Child Counts – Education of migrant children

The roundtable started with Padmaja Pore introducing Door Step School, an NGO that runs several projects around primary education. One such project is Every Child Counts (ECC) that was started in 2011 and focused on ensuring that  every child goes to school at the right age of 6-7 yrs. Through ECC, Door Step School seeks to understand and address barriers  to the schooling of kids of migrant communities such as those engaged in nomadic professions,workers at construction sites, factories, brick-kilns, etc. in the vicinity of Pune city.  When parents move their home several times in a year itself, how can it be ensured that their kids remain enrolled in schools?

In India, there are more than 1 million kids out of school (18 million in Southern Asia and 69 million globally). The Right to Education Act has ensured that free and compulsory education is available, but no systematic process of finding and enrolling out-of-school not been actively implemented, with no definite count of the number of migrant children denied education. Surveys have been focused on children already working/street children, whereas the need is to focus on children who are 6-7 years old so that they are enrolled into schools before they get drawn into employment. There have been no active steps to put in processes at schools for ensuring migrant children can transition smoothly to another school when they migrate. .

The ECC Project has the following Implementation Methodology, which is volunteer driven

1. Surveys: Volunteers conduct surveys of construction sites in partnership with NGOs
2.Preparatory camps: Through the medium of preparatory camps, awareness is spread amongst parents of children on the importance of schooling. After working with the children, the team realized that these kids are not aware about the concept of formal education, and are not used to sitting at one place for a few hours to study. Thus the focus in the preparatory camps is on interactive activities to get kids more accustomed to the environment.
3.Admission/ Enrollment: The children and parents are accompanied to a local public school and assisted with the enrolment process. Parents are made aware of the provisions of the RTE act.
4.Support and Follow-up: Arranging transport to school wherever needed, tracking attendance and addressing reasons for non-attendance

The ECC project is currently running in Pune, Pimpri Chinchwad, Fringe areas of Pune & Nasik. The project uses various types of data:

  • Unified DISE data on schools, which is comprehensive but lacks spatial aspect
  • Crowdsourced spatial data of public schools
  • Spatial data of construction sites – Both crowdsourced and taken from real estate portals & builders websites
  • Spatial mapping of volunteers in the field
  • Children at each construction sites, spotted by volunteers and NGO staff

Data sources: http://schoolreportcards.in/SRC-New/ & http://www.dise.in

Currently the data is collected using a mobile app based on ODK (Open Data Kit) & KoboToolbox/ONA. The team is developing a Web based Platform for scaling the ECC Program pan-India and engaging NGOs and CSR groups in this cause. One of the key features of this Website is envisaged to be to engage volunteers actively with children to help motivate, enroll and track their continuity for larger impact.

Challenges

Padmaja then talked about the way forward and the challenges they were facing w.r.t developing the ECC Platform as well as actually reaching all children in the project areas.

  • No formal source available for school locations, hence data is still partially incomplete and dependent on crowdsourcing of school locations.
  • Need a systematic way to predict locations of existing and future construction sites to find migrant labourers.Set up an ERP like system to record a child’s details, so they can be tracked after migration as well
  • Create a mobile friendly website for the Platform
  • Create more interactive maps and chart visualizations, showing schools, sites etc (heatmap or other suitable format) for providing an aggegation/ disaggregation of data on migrant children. This can help in advocacy efforts.
  • Explore ways to track migrated children Find ways to dynamically update the databases and see changes in map/chart visualizations after a volunteer makes an entry on the mobile survey form.

After the talk, everyone pooled in with their ideas and suggestions such as connecting with Trekking communities to pair up as volunteers to reach out to any schools/kids on the outskirts of the city, and collaborating with initiatives like Sagar Mitra (Recycling plastic). Few problems were taken up by individual attendees for further discussions, like finding ways to automate the data entry into excel which is done manually right now. Interested attendees were requested to volunteer and also reach out to their community to spread the word.

Village level Mapping

IMG-20160120-WA0000

For the second talk, Jinda Sandbhor from Manthan Adhyayan Kendra spoke about village level mapping of tanker water supply in Maharashtra. With 14,708 drought affected villages in 2015 and 148 drought prone blocks, there is an immediate need for collecting data to analyze the reasons for drought and what can be done to better prepare for the future.

Most villages facing drinking water shortages due to lack of piped
water supply or lack of drinkable ground water. For such villages,
there is a tanker water supply from the Maharashtra government. The shortages are most severe just prior to and during the monsoon, some of these villages get return (North East) monsoons which reduces the demand of tankers by the end of the year. Jinda showed some aggregate data that has been collected that shows blockwise, the number of villages requesting the tanker supplies during
various months in the past few years.

There are multiple reasons for the demand of tankers:

  • Less rainfall & resulting drought is the main reason
  • Anthropogenic contamination of ground water
  • Dumping of mine water into the river

Challenges

Jinda highlighted his efforts to collect village specific data in some districts on the reason for request of the tanker. He mentioned that there is need for a village-level base map for Maharashtra that can help visualize and analyze this issue.
The discussions after this talk were focused on GIS related topics, with everyone agreeing for the need for detailed village level maps. While there are village level maps available in PDF as well as as a Web Map Service by Bhuvan, these need to be converted into shapefiles so they can be used for further analysis. This will enable visualizing with great accuracy, not just drought related data but any number of socio-economic parameters of Maharashtra for analysis.

It was also recommended to connect with Prof. Ashwini Chhatre from Indian School of Business (ISB) who has been working on Millets & Irrigation data and would have more detailed maps of the state. Another suggestion was to use GIS to take Land Revenue maps and convert into public-domain data.

Tools for participation in city governance

IMG-20160120-WA0001

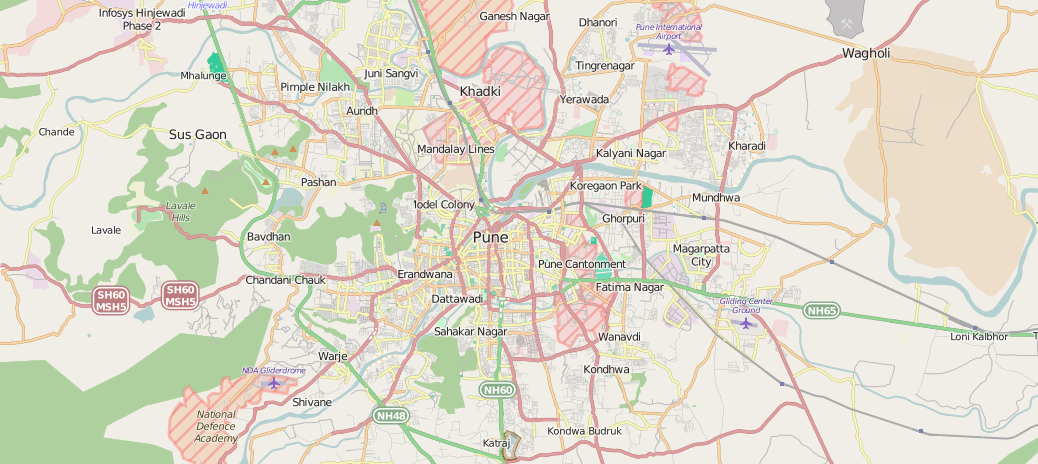
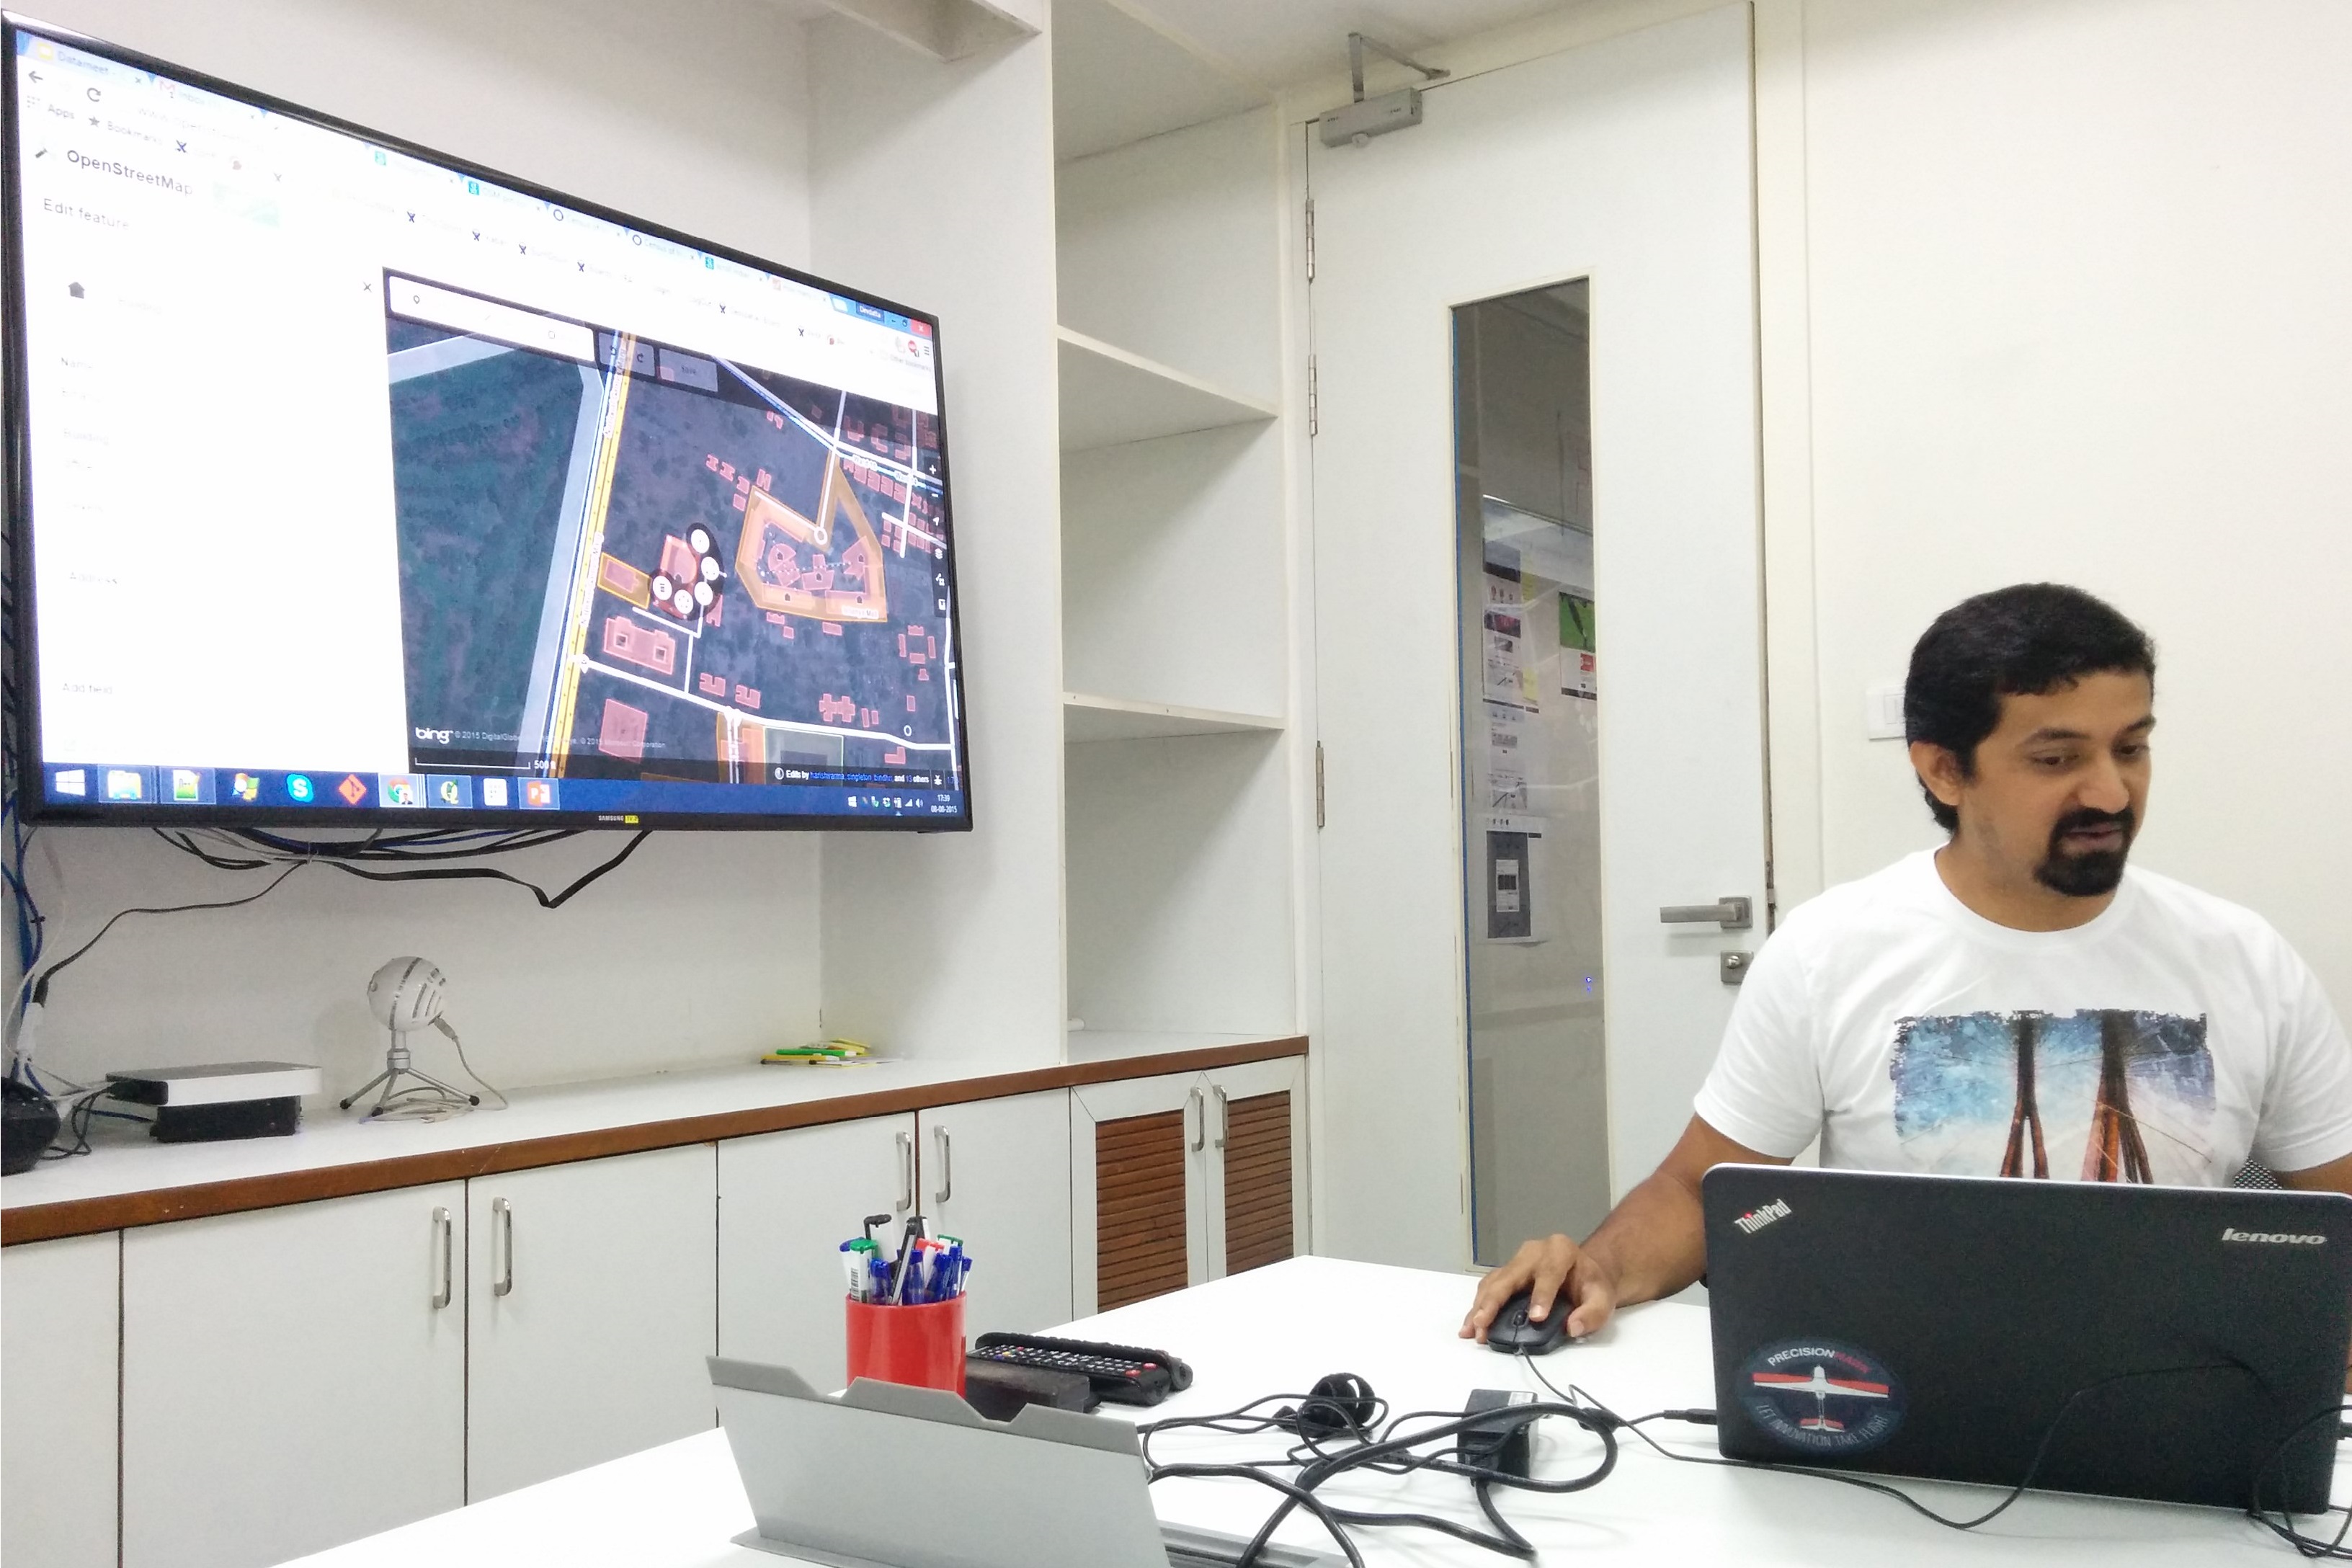
The third talk was by Nikhil VJ who is the co-organizer of the Pune Datameet chapter and has been working on multiple data-centric projects. He also showed his work on cleaning and mapping Pune’s Budget sheet, which was originally available as a 600 page PDF and now has been converted to excel and cleaned up considerably. The Pune Municipal Corporation has now agreed to bring in some reform in its budget book format and Nikhil & CEE are working on possible ways to take such tasks forward. Nikhil also covered several tools and methods described below that are easy for anyone to pick up and can help solve some interesting data-related problems.
Some of the resources mentioned by Nikhil were:
The newly launched website www.sahbhag.in — Participatory Urban Governance in Pune
nikhilvj.cartodb.com — Maps & Datasets of Pune posted online by Nikhil
www.crowdcrafting.org — Collecting & mapping of data with the power of crowdsourcing
Localizing Pune’s budget data by Nikhil & other volunteers:
http://crowdcrafting.org/project/localpunebudget
Map form — An experimental method that Nikhil has craeted to collect location data using WordPress plugins
www.mapwarper.net — Using maps that are currently as an image to wrap on
an actual map

With this, the session was formally concluded.


Data{Meet} Pune, Second Meetup – Let’s talk Mapping

The 9th of August, 2015 marked 11 years of the OSM project. On the same weekend Datameet Pune fittingly held its second meetup, ‘Let’s talk Mapping’. The session was led by Devdatta (Dev) Tengshe, a veteran of the Bangalore Datameet group who has several years of experience in GIS and remote sensing having worked previously for ISRO. Dev initiated with a primer on what spatial data is and what can be done with spatial data, then followed with an introduction to GIS, a demonstration of OSM and information on sources for spatial data in the Indian context. His presentation can be found here. Below are the highlights of the session.

What is spatial data? Its uses?

Spatial (data) is not necessarily ‘special’ as many say. It is simply data with a spatial element to it, this could be latitude-longitude but pin codes and postal addresses could be used as spatial formats too. There are numerous advantages to viewing/analyzing social sector data spatially, whether it is census data, land records, city water supply/sewerage networks or other datasets. Spatial representation helps detect patterns and trends that may otherwise go unnoticed. Spatial data in the social sector also comes with its set of challenges.  Maps of land parcels for example are not recorded in any standardized way across the country, but instead using local landmarks (turn left at this tree, go straight for 50m, then turn right and head towards the banyan tree) Much of census data is also not easily available at the finer local levels, but only at the district level.

Spatial data can be used to solve spatial problems. Spatial data visualizations work with the strength of the human eye, which is to detect patterns visually. In the exploratory stage you may visualize it to detect patterns, e.g. a map of a user’s Facebook friends may unknowingly reveal areas of low internet penetration, a comparison of Bangalore’s bus routes vs Pune’s bus routes show a stark difference in connectivity. In further analysis you may also find spatial correlations. Spatial modelling is yet another application. These processes are in fact the same ones you would use with regular data, and like all other data, spatial data too requires a lot of cleaning.

IMG_20150808_174421

GIS 101

The real world is infinitely complex. To represent this spatial world in data we have to develop simplified models. These can be either Vector or Raster models. In vector models, we use points, lines and polygons to represent real world features (e.g. bus stops, bus routes, ward boundaries) whereas in raster models we use images of the earth’s surface taken by satellites, or UAVs which are composed of pixels to view the earth’s surface.

File formats for spatial data:

Vector

shapefiles are used within desktop softwares (QGIS, ArcGIS), geojson is used for web mapping (these are light, human and machine readable), kml (first developed by Keyhole, later bought by Google) is also a common format.

Raster

tiff (multiple bands) format allows for storage of larger datasets.

Spatial databases are now able to handle spatial data, allows spatial queries related to it, so a user doesn’t have to write out the logic for such operations (e.g. of spatial queries: Find the nearest school/hospital to this village?). Spatial databases are used by retail businesses, housing, utilities and many other commercial ventures.

Where do I get spatial data?

The Beg-Borrow-Steal theory

Beg

Create it yourself. In the process of field work you can use field kits to collect spatial data for your area of interest. Tools available for this include Locus map free – Outdoor GPS (App) OR Open Data Kit (Software suite). As an alternative, you may also digitize from satellite maps

Borrow and convert it

Data that may be available freely but not in a form that is easily usable and may need to be georeferenced.

“Steal”

Spatial data can be ‘scraped’ from websites that contain this data but do not make it easily available, see github datameet maps for examples of data collected from census websites. Although permission may not explicitly be given for this, since it is already up on the web and no copyright exists on the data it is implicitly understood to be open source.

Open Street Map (OSM)

The Wikipedia for spatial data, OSM, counts more than two million users who voluntarily contribute to the project. OSM was first aimed to collect just street data, but it has now expanded tremendously. City data in OSM is of high quality however for rural areas, only major roads can be guaranteed.

Unlike Google maps which does not allow a user direct access to its data, OSM raw data is available for download as well as editing. Within OSM users can tag different aspects of any object, giving others more information about it. Users can also introduce new key:value pairs if needed. OSM scripts monitor changes and an IRC chat room verifies these changes. OSM updates frequently and is therefore used in humanitarian situations (HOT OSM). Only 12 servers run all of OSM

IMG_20150808_173926

Wikimapia in comparison is limited, it allows you to draw on google maps, but there is no verification of additions and limited data download.

There are independent initiatives to make available raw data download from OSM [See slide 47] Similarly other apps use and make available OSM data, Map quest for instance gives directions based on OSM data. If you are unsure of the final use of your data you can download data in OSM XML format, since it contains everything. GeoJSON is useful only when you need shapes, not other features of spatial data.

Sources

  • Downloading OSM data for a country: Geofabrik
  • Downloading OSM data for any custom polygon: BBBike
  • Raw data based on particular data queries: Overpass Turbo

Spatial data in the Indian context

Districts/Tehsils

Shapefiles for districts and tehsils are available on Github, Datameet maps. However maps must be verified against other sources of data. In reality there is dispute even within the Indian government on how many districts India has.

Village boundaries

In reality, in many cases no fixed village boundaries exist, the Census uses blocks and settlements for reference. Some states however make available static maps showing village boundaries that can be georeferenced.

Pin codes

Can we divide the country into pin codes? Pin codes do not represent an area, they are points along a line where the postman will deliver. Hence the assignment of addresses to the last  three digits of a pin code is a decentralized decision. The lowest level of post offices decides. Pin codes also do not cover the entire country. Post offices to Pin codes do not have a one-to-one relation.

Census data

Census data at the finest spatial level comes down to census ward boundaries. Nobody outside the census department actually knows these boundaries. Pune city has 700 census ward boundaries (which do not correspond to administrative/electoral ward boundaries) mostly hand drawn. District level offices may have maps with these boundaries as hard copies.

Nothing in national policy disallows them from sharing them, but nevertheless government officials aren’t inclined to share such information. Certain limitations however do exist on government data sharing, protected military areas, areas near the national boundaries, topography maps etc. are prohibited.

Basemaps and DEMs (Digital Elevation Models)

The Open data initiative of the Government of India has created some 5400 odd ‘Open Series maps’ i.e. toposheets without height information. None of these are done digitally or printed. They can however be used with gps data since the lat-long is accurate.

Since GoI topography data isn’t made openly available, alternatives available are SRTM, ESTER and Bhuvan Cartosat. These are good for example for larger rural areas, but not feasible for urban areas. Private companies work with UAVs for very high resolution elevation data. For satellite imagery as basemaps, Landsat imagery, going back to 1970 is available.

Closing Remarks

In following up with our discussions on mapping, for those of you who are interested, we have several Pune specific mapping tasks that individuals can contribute to. E-mail us at pune@datameet.org for more information. We hope that everyone found the discussion useful and thank you for coming, thanks to Dev for the informative session! Thanks to Shraddha and Thoughtworks Pune for hosting us. Do connect with us via social media [Twitter] or join our mailing list for information on the next meeting.

Data{Meet} Pune – First Meetup

Datameet Pune, hosted its first meetup last Monday, the 13th of July at Thoughtworks, Pune. The idea of DataMeet which originated in Bangalore as a community of data enthusiasts, working on civic issues has now spread to several cities across the country, Pune being the latest.

Datameet Pune - First Meetup (1)

Twenty-six people of diverse backgrounds, both from the programming world (students and professionals) as well as those conversant with social sector issues (NGOs and citizens) attended the meeting (including 3 via Google Hangout). A icebreaker and a game of Pune related trivia got the meeting off to a start. Participants introduced themselves and their broad areas of interest. Ideas revolved around public transport, voter registration, land use change, water and sanitation, waste management, education, mapping, data visualization and more. The organizers then gave a brief presentation on the idea of DataMeet, examples of data successes in the social sector elsewhere and the possible scope of projects that can be explored within the Pune group. Nikhil welcomed those interested to pitch in on some of his projects related to Pune’s bus routes management system and Pune’s budget sheet.

Datameet Pune - First Meetup (2)

The floor was then open to the participants to QnA and ideas. Participants discussed the format of further engagement within the group. They agreed that it would be best to start off with monthly meetings organized around topics (related to data and civic issues) where a speaker could initiate discussion based on his/her experience. Topics suggested were mapping, basic statistics, R/Python, better data analysis with Excel, etc. Dev, Vinayak and Rasagy originally from the Bangalore DataMeet agreed to initiate discussions on possible topics. Rahul, urged that the topics taken up by speakers should have a practical orientation rather than being more theoretical, since seeing practical applications tends to interest people more. Sanskriti also suggested sector specific meetups for example on transport, since the Pune public transport service (PMPML) is launching a new BRT route. Participants were briefed about hackathons and Open Data Camps (ODCs) which have happened in other cities and it was suggested that Pune could explore these formats as well.

The forum for online engagement of the Pune group, suggested by Vinayak, was Slack.com, to which everyone was agreeable. (a Slack channel was later setup for the Pune group on the main Datameet Slack). For in-person meetings, everyone agreed to meeting once a month, and Saturday was the day agreeable to most, early evening or morning were suggested as possible timings. Additional venues, including CEE, Drive Change, Flame University and Indradhanushya were also suggested. A meetup page was setup by Anurag, for updates about future meetups.

Participants were also strongly urged to fill out the DataMeet Pune Interest Form to hear about future activities, available here. The meeting was overall a great success,the participants showing a lot of enthusiasm for actively collaborating together. Please stay tuned for announcements of future meetings. In the meanwhile you can find the Google Hangout recording of the meeting here. For Pune specific queries please email pune@datameet.org or contact Craig/Nikhil.

Craig D: 7276085960, craigds022@gmail.com or Nikhil VJ: 9665831250, nikhil.js@gmail.com