Category Archives: Reports

Home for All our Maps

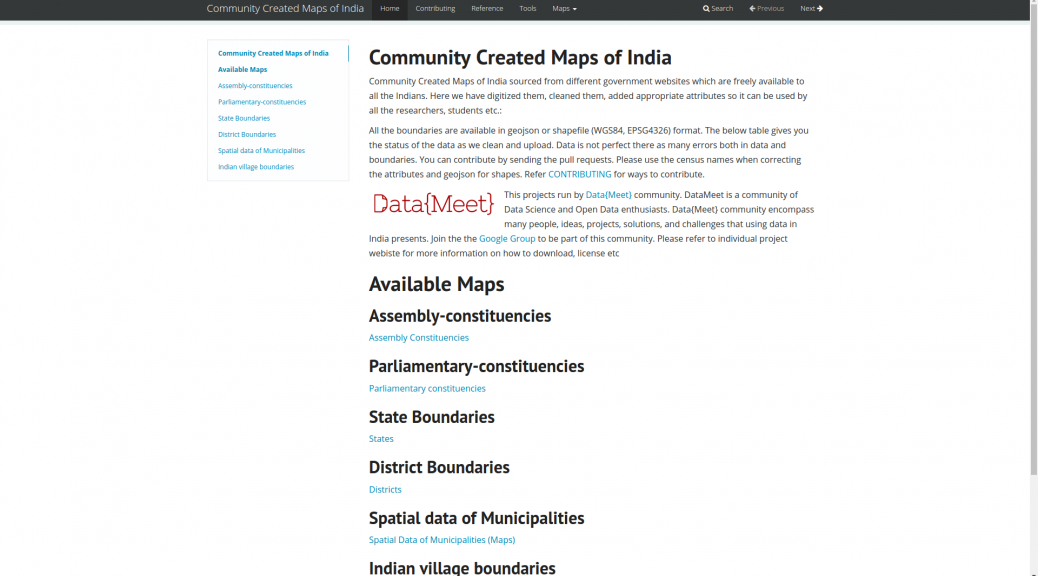
Over the years DataMeet community has created/cleaned lots of maps and made them available on GitHub. One of the biggest issue we had was visibility. Larger community couldn’t find them using google or couldn’t figure out how-to download maps or use them. Basically we lacked documentation. Happy to say we have started working on it

The home of all the projects will be

http://projects.datameet.org/maps/

From there you will be able to find links to others, This is the link you can use to share in general. More links below.

Most documentation have description of the map, fields, format, license, references and a quick view as to how the map looks. For example check the Kerala village map page.

There is a little bit of work left in documenting the Municipality maps. I am working on them. Otherwise documentation is in a usable state. P

lease add your comments or issues on GitHub or respond here. Each page has a link to issues to page on Github. You can use it.

In future I will try to add some example usage, links to useful examples and tutorials and also build our reference page. I am hoping

Thanks to Medha and Ataulla for helping to document these projects.

A few days back I also wrote about Community Created Free and Open Maps of India, let me know if I have missed any projects. I will add.

Map links

On github they remain same, We have mainly three maps repos

Data Policies in Telangana

Government of Telangana  has launched four IT policies related to data on cybersecurity, data centers, data analytics and open data. Honorable IT Minister K T Rama Rao has announced the intention of separate sectoral policies through the launch of Telangana IT policy in the month of April’16. During the launch he stressed the importance of open data policy for the state. In his own words:

” Telangana will be among the pioneers in the country in coming up with this open data policy. The open data policy is the first step in opening up government data to a host of potential applications. The policy sets the necessary framework in place to operationalize the state open data portal. The policy has many enabling provisions in place for multiple stakeholders. Through this policy we hope to catalyze data and to make data driven decision making possible and development of important solutions for societal benefits. “

These policies were made after several consultations with industry, academia, civil society and various individual experts. Though the policies focus on individual sectors primarily, most of the elements are inter-linked with the common element of data.  While the state government intends to foster its economy and business with the help of data, the open data policy focuses on enabling transparency and human development apart from economic development. Telangana, an IT rich state following open data practices will be a major boost for the ecosystem in India too.

We have been interacting with officials from Government of Telangana since December ’15, providing appropriate suggestions for the open data policy. Dileep Konatham, Director for Digital Media, Department of Information Technology was our esteemed panelist during discussions on Digital India at Open Data Camp Delhi ’15.  Datameet will work with the Government of Telangana to help implement the policy with necessary suggestions for guidelines and community building over the coming months.

Links to the policies launched:

Happy Independence Day and Open Indian Village Boundaries

One of the longest and most passionately discussed subject on the Data{Meet} list is the availability of Indian Village Boundaries in Digital format. Search for Indian Village shape files and you can spend hours on reading interesting conversations.

Over last two years different members of community have tried to digitize the maps available through various government platforms or shared the maps through their organizations.

A look at the list discussion tells you that boundaries of at the least 75% of the states are available in various formats and quality. What we need at this point is a consolidate effort to bring them all on par in format, attributes and to some level quality. So some volunteers at Data{Meet} agreed to come together, clean up the available maps, add attributes, make them geojson and publish them on our GitHub repository called Indian Village Boundaries.

Of course this will be an on going effort but we would love to reach a baseline (all states) by year end. As of now I have cleaned up and uploaded Gujarat. I have at the least 4 more states to go live by month end. Karnataka, Kerala, Tamil Nadu and Goa. I will announce them on the list as they go live.

The boundaries are organized by state using state ISO code. All the village boundaries are available in geojson (WGS84, EPSG4326) format. The project page gives you the status of the data as we clean and upload. Data is not perfect yet, there could many errors both in data and boundaries. You can contribute by sending the pull requests. Please use the census names when correcting the attributes and geojson for shapes. Please source them to an official source when sending corrections.

Like everything else community creates. All map data will be available under Open Data Commons Open Database License (ODbL). This data is distributed in the hope that it will be useful, but WITHOUT ANY WARRANTY; without even the implied warranty of MERCHANTABILITY or FITNESS FOR A PARTICULAR PURPOSE. If you find issues we are more than happy to accept corrections but please source them to an official source.

On this 70th Independence day, as we celebrate the historic event of India becoming Free and Independent, Data{Meet} community celebrates by cleaning, formatting and digitizing our village boundaries. Have a great time using the maps and contributing back to society.

https://github.com/datameet/indian_village_boundaries

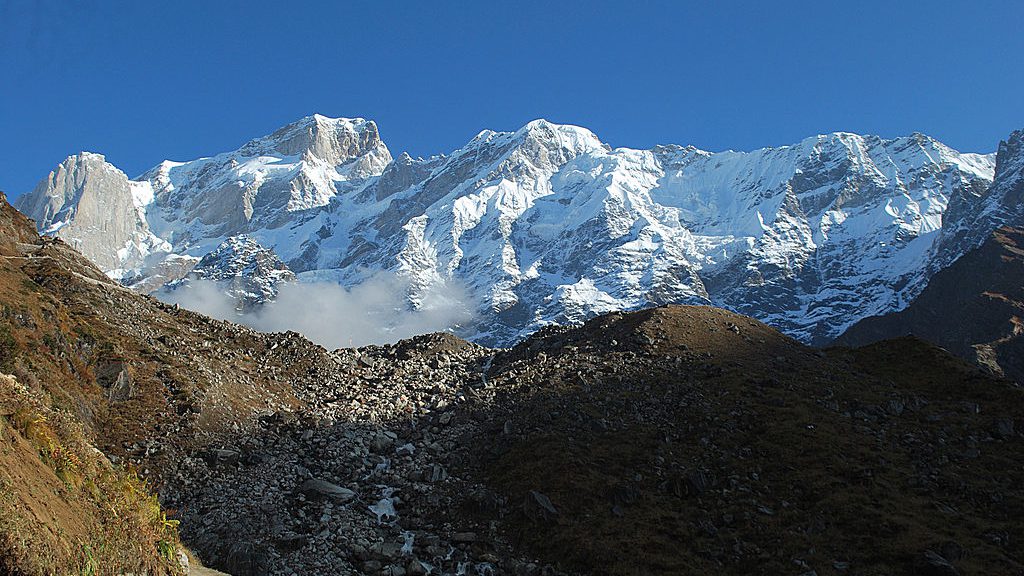
Picture: Kedarnath range behind the Kedarnath temple early morning. By Kaustabh, Available under CCBYSA.

Our Comments on Draft Government Open Data License

A draft government open data license has been released by the oversight committee implementing National Data  Sharing and Accessibility Policy (NDSAP).  This license will be ideally applicable to all datasets being shared under NDSAP and through Open Government Data Platform (data.gov.in) and has been visioned to support all government data for public use.

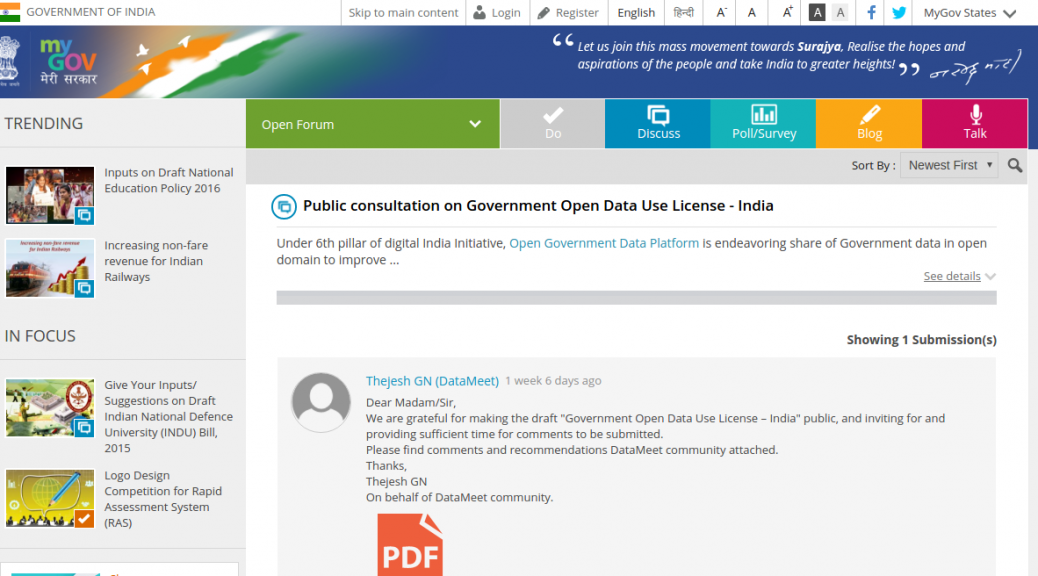
While we welcome the requirement for a license to share government data, the license oversteps its boundaries in certain clauses and restricts data rights of users and citizens accessing public data along with a clause for no warranty of data. It also transfers liability of accessing sensitive data to the user and grants impunity to the data controller releasing such data incidentally or accidentally. Our submission for draft consultation has been uploaded to my.gov.in .  Please go ahead a do an upvote if you agree with our submission.

Other notable submissions are also being shared for reference.

Submissions from Medianama
Submissions from Factly

Bihar Elections

DataMeet has always been interested in doing projects so last year we decided to run a pilot. In the last few years the demand for data work has increased from non profits and journalists and they usually approach data analytics vendors like Gramener. However, these firms can be expensive or have high paying clientele which means that smaller accounts tend to not get their full attention. This leads to an increase in volunteer events like hackathons which don’t always result in finished usable products or can give non profits the long term engagement they need to solve issues. Vendors are not usually privy to the specific data problems a sector has and don’t want to let their tech people invest the time to learn about the subject and understand the particular data challenges. Though the civic tech space is growing, non profits and media houses can’t yet afford or see the need for internal tech teams to deal with their data workload.

With all this in mind we wanted to see if DataMeet can help fill and enrich this space as well as help build capacity within non profits to manage data projects. We were trying to find out, can we assemble teams through the DataMeet network to manage the entire pipeline of data work from clean up to visualization. These wouldn’t be permanent teams but filled with freelancers or hobbyists.

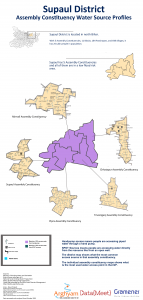
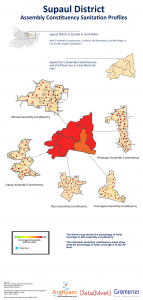
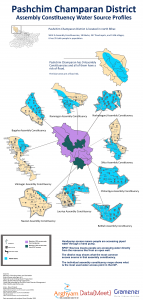
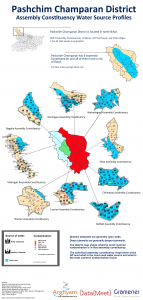
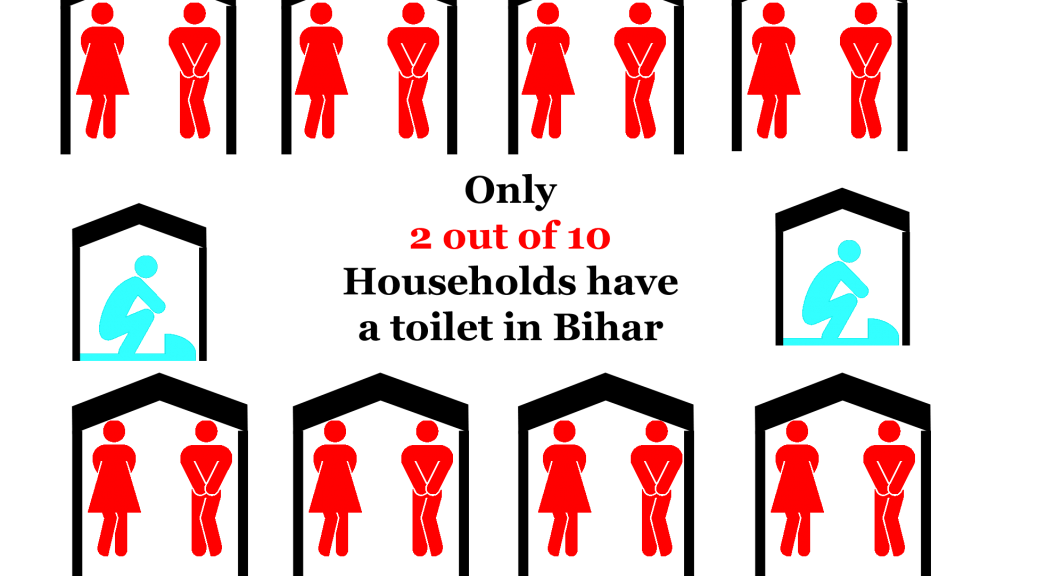
For this first project DataMeet would project manage and Gramener would provde the data analysts, the non profit managing partner was Arghyam and the ground partner was Megh Pyne Abhiyan. Megh Pyne Abhiyan works in several districts in north Bihar on water and sanitation issues. They wanted to use data to tell the story of what the status of water and sanitation was in those districts as a way of engaging with people during the election. It was decided we would do water and sanitation (WATSAN) status report cards for 5 districts — Khagaria, Pashchim Champaran, Madhubani, Saharasa, and Supaul — using government data.

This was an exciting project for us because it would be the first time DataMeet would work with a partner who works on the ground and the output would be for a rural, non online, non-English speaking audience.

DataMeet would project manage the process of data cleanup, analysis and visualization (which the team from Gramener would do) and then give the report cards to the Megh Pyne Abhiyan for them to do the translation and create the final representation of the report cards for their audience.

The Data

The partner wanted the data to be mapped to Assembly Constituencies, they wanted analysis for following situations

  1. Sanitation coverage for each Assembly Constituency and Gram Panchayat.
  2. Water quality, what is the contamination situation of the district, Assembly Constituency and Gram Panchayat.
  3. Water access, how do people get their drinking water.

It was also important to understand this data in the context of the flood prone areas of Bihar. For instance if there is an area that gets drinking water from shallow wells, with little sanitation in a high flood area those areas can suffer from high levels of water borne diseases.

The data we got was from

Since we were doing report cards based on Assembly Constituencies we needed the data to be at the Gram Panchayat (GP) level. Luckily the MDWS does a good job of collecting data all the way down to habitation so GP level data was available.

There is no official listing of what GPs are in which Assembly Constituency so the partner was asked to split the data by AC so we wouldn’t have to do that mapping. They agreed they knew the area better and would have the resources to pull together all the GP level data into organized Dropbox folders grouped by districts then split into ACs.

Data Cleanup

We received one PDF file per GP,  for water access and number of toilets, water quality was given in one large file by district.

All the data we received was in PDF. This was a huge hurdle as the data was from the government information management system so it was from a digital format but rendered in a PDF this meant that we had to convert unnecessarily. However, since the ground partner picked the data they needed and organized it by AC we wanted to make sure we were using the data they specified as important. So we decided to convert the data. This job was done by Thej and I and was extremely manual and time consuming and caused some delay in the data being sent to the analysts.  (See how we did it here.)

Analysis

The analysis required was basic. They needed to know at an AC level what the sanitation coverage was, the sources of water, how people were accessing it and what the water quality situation is.  Rankings compared to other districts and ACs were done to give context. Rankings compared to other districts and ACs were done to give context.So in all the analysis stage didn’t take much time.

Example of Analysis


Visualization

The UNDP along with the Bihar State Disaster Management Authority had created a map of diaster prone areas including flood. It was in PDF so we asked the folks at Mapbox India to help out with creating a shapefile for the flood map so we layer flood areas onto the Assembly Constituencies.

Bihar AC map with flood prone areas


While we had AC maps we didn’t have GP level maps. They didn’t seem to be available and we couldn’t find them in PDF form either.

Since the election is staggered by district we started with Khagaria. After the initial report cards were done the partner wanted just the cleaned up data in tables to use for their meetings. So we then decided to do the report cards, clean up the data and send the spreadsheets over to them.

As we were processing the next 4 districts I found GP level maps of Bihar, with boundaries of ACs included. This was quite exciting and I thought since we had some time we could do maps for the four pending districts.

After receiving the analysis for the next district I decided that since it would take to long to trace the PDF maps, so the analysts could map the GPs, I would just over lay them onto our AC shapefiles in Photoshop. I was going to put icons or circles in the center of the GP and that would be the map. While tedious I figured it would be worth it to show the maps to the ground partner.

However, when I started mapping I realized that analyzed data wasn’t matching up with the GPs on the map. The GPs listed in the Assembly Constituency in our original folders were incorrect, which meant all the analysis was wrong. Everything had to be checked against the maps and reorganized in the final datasets and then reanalyzed. This caused a huge delay.

On top of that the GPs on the map were spelled differently than in the MDWS data, and every dataset potentially had a different spelling of a particular GP. Which meant the remapping of the data had to be done manually looking at the map, the data, other sources, and sometimes guessing if this was the correct GP or not. This ended up being a manual process for every AC, as we didn’t do this mapping and standardization in the beginning.

While the delay caused problems with the maps being used in the election, they were worth doing to understand the problems with the data and the ground partner identified with the maps the most. By the end we were able to produced districts posters for the different parameters.

Sample report card


Final Posters

PC_sanitation copy poster madhubani_wateraccess copy poster madhubani_sourceprofileposters madhubani_sanitation poster Supaul_wateraccess copy poster copy Supaul_sourceprofile poster copy Supaul_sanitation copy poster copy Saharsa_wateraccess copy poster copy Saharsa_sourceprofile poster copy Saharsa_sanitation copy poster copy PC_wateraccess copy poster PC_sourceprofile poster


Lessons for next time

We learned a lot from this process. Mainly that the issues with standardization of Indian names in data is a real concern. While initiatives like Data.Gov.In are an important first step, it will take real will and dedication to work out this problem.

NGOs and groups that don’t work with data at the scale of modern data techniques are not always familiar with issues like formats, standardization problems, data interoperability,visualization and mapping to other datasets. This means that more time needs to be spent getting the intentions of the project out of the partner not just outputs. Problems like PDFs are not things everyone thinks about so the extra time of working with the partner to understand what data they want and find way to get it are better spent then converting PDFs to CSV if we don’t have to.

Designers are important, I created and designed the maps and posters, while I’m proud of them, they could have been done better and faster by a trained designer. Designers are worth the money and effort in order to make the final product really reflect the care and work we put into the data.

I consider this experience a success, despite the setbacks, we learned how to manage a team that was not full time and how important the initial work with the ground partners are to create realistic deliverables and timelines.

You can get all the data on DataMeet’s github page. 

Big thanks to the Gramener team – Santhosh, Pratap and Girish for dedicating their free time to this.
Five Years of DataMeet Discussions

We consider 26/01/2011 as DataMeet birthday. Thats the day we talked about starting DataMeet and hence it is the birthday. But the first email to the group was sent by S.Anand on 27/01/2011. Its been five years since that first email. I took this opportunity to scrape the email list to see how we are doing and what we talked about in last five years.

Growth

Activity

Members have started 1525 and have sent in total 4570 emails. But most important is how many participate.
infogram

Category Members
No Emails 855
1 Emails 184
2 Emails 75
3 Emails 43
More than 3 189

Discussions

Go have a look at full view of the traffic graph. Except for few peaks the group has been fairly consistent.

Starters

We have discussed about 1525 in last five years. Here is the list of top 20 starters.

author total topics started
Nisha Thompson 199
Thejesh GN 164
sumandro 71
Sridhar Gutam 64
srinivas kodali 36
Gautam John 30
Sajjad Anwar 28
Pranesh Prakash 27
bawaza…@gmail.com 27
Venkatraman.S. 23
satyaakam 22
S Anand 21
Balaji Subbaraman 20
Nikhil VJ 19
Justin Meyers 15
Sanky 15
Dilip Damle 14
Maya Indira Ganesh 13
Shree 13

First Responders

The first responders are important when someone posts a question. They are the first ones to respond to the questions. As you would have guessed the list is different from the starters list.

author number first response
Devdatta Tengshe 36
Gautam John 36
Nisha Thompson 57
srinivas kodali 28
Thejesh GN 27
Sajjad Anwar 21
satyaakam 20
Arun Ganesh 16
Avinash Celestine 15
Venkatraman.S. 15
Anand Chitipothu 14
sumandro 13
Dilip Damle 10
JohnsonC 10
S Anand 10
Gora Mohanty 9
Meera K 9
Sabarish Karunakar 9
Nikhil VJ 8

Part of many discussions

These are the members who have participated the most.

author total_emails_sent
Nisha Thompson 397
Thejesh GN 297
Gautam John 158
srinivas kodali 128
sumandro 109
Sajjad Anwar 93
Arun Ganesh 88
Dilip Damle 88
Devdatta Tengshe 85
satyaakam 83
Sridhar Gutam 81
Avinash Celestine 73
Justin Meyers 71
S Anand 68
Pranesh Prakash 67
Venkatraman.S. 64
Nikhil VJ 55
Raphael Susewind 55
Anand Chitipothu 51

Topics

We have discussed many many topics over years. But there are some popular topics. I have the list of topics by most replies.

Starter date/time topic
Karthik Shashidhar 2015-05-04 23:00:01 Shapefiles for "complete" India
megha 2014-04-10 14:10:21 MP/MLA Shapes
Srihari Srinivasan 2013-03-06 22:59:44 List of BMTC Bus stops
Nisha Thompson 2014-05-20 23:51:49 Logo Contest Voting!
S Anand 2016-02-01 18:31:38 PIN code geocoding
Siddarth Raman 2014-04-17 16:16:29 Parliamentary Constituency to Assembly Constituency to Ward linkages
Nisha 2013-04-15 09:44:21 April's Bangalore DataMeet
Gautam John 2012-04-14 09:49:50 I Change My City
Arun Ganesh 2011-03-14 11:23:25 Licensing crowdourced data projects
Sharad Lele 2015-11-27 19:59:49 Census of India seems to have maps of everything!

We also get quite a bit of traffic through search engines. So here is the list of top topics by views.

username date_time views topic
Karthik Shashidhar 2015-05-04 23:00:01 12324 Shapefiles for "complete" India
S Anand 2016-02-01 18:31:38 4783 PIN code geocoding
srinivas kodali 2013-07-01 12:49:33 2291 GeoJson data of Indian states
Aashish Gupta 2014-02-24 10:23:12 763 1981 and 1991 district-wise census data
Justin Meyers 2014-07-26 22:05:13 668 Updated Taluk Shapefile!!
indro ray 2013-08-13 10:21:18 651 MCD Delhi Admin Boundary GIS map
My profile photo 2012-08-30 17:41:45 615 Bangalore – BBMP ward boundaries – shape files available now
megha 2014-04-10 14:10:21 556 MP/MLA Shapes
Kavita Arora 2012-09-13 23:32:25 546 Ward Wise data for Bangalore – 2011 census?
Renaud Misslin 2014-12-03 09:45:16 426 Delhi ward shapefile for census 2011 data

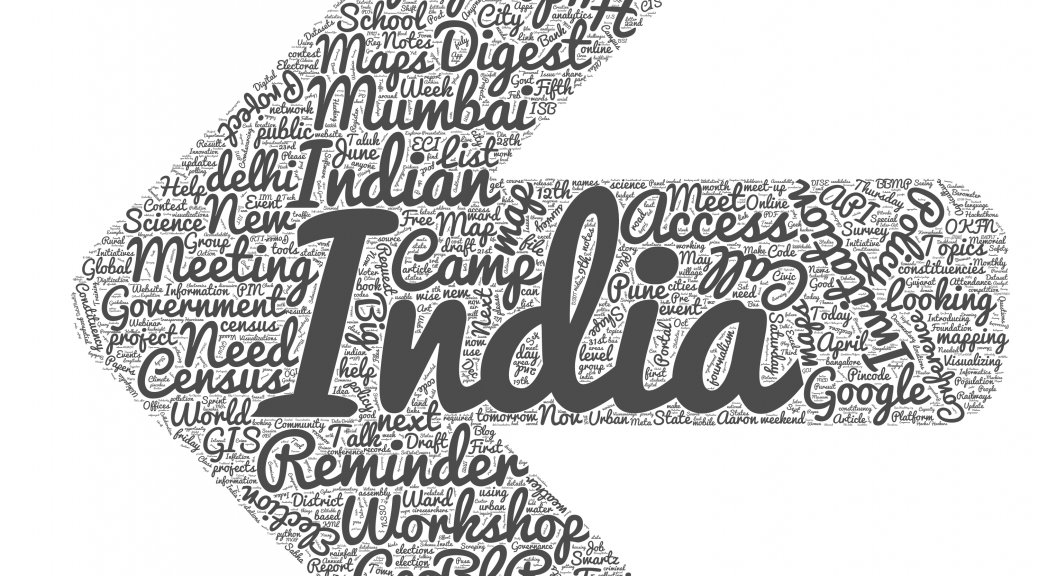
At last customary wordcloud of topics.

wordcloud_subjects_arrow2

Of course all the scrapers and data is available on github. Go ahead make your own visualizations.

Delhi Jal Board and Open Water Data: Report from DataMeet-Up

A DataMeet-Up was held on Thursday, April 30, 2015, at the Akvo office to discuss the Summer Action Plan prepared by the Delhi Jal Board (DJB) and the data concerns thereof. Sundeep Narwani of Delhi Dialogue Commission presented the Action Plan. Kapil Mishra, MLA and Vice-Chairman of DJB, participated in the discussions and described the planned activities at DJB.

Here are the minutes of the meeting, prepared by Sandeep Mertia.

Sundeep Narwani, started with a presentation on Delhi Jal Board’s Summer Action Plan (SAP) 2015. Some important point from his presentation were:

  • SAP is a short term measure for three months of summer
  • Big problem: 40% of Delhi does not have enough piped water networks, and thus tanker services and unauthorised supply exist
  • They have planned several measures for improving the systems of – tube wells, infrastructure (replacing old lines) and repairs, grievance redressal and sewage treatment.

The details are available in the Summer Action Plan document.

This was followed by a long discussion session on several issues and concerns – related to water problems in Delhi. Some of the important questions, comments and suggestions were:

  • What is the authenticity of data which DJB has?
    Answer: Doubtful.
  • What’s the organisational structure of DJB, and its relationship with the MCD?
    Answer: DJB is a state body, independent from MCD
  • There is no data on bulk supply to colonies
  • Very little end user data. Lack of meter reading and averaged bills are part of the reasons for this problem
  • There is no way to interconnect supply between localities
  • No data on quality of water
  • Dr. Rajinder Kaur spoke about using existing spatial data maps of NCT/NCR, and the research conducted by the Indian Agricultural Research Institute on using spatial data for classifying ground water depth and quality
  • Dr. Renu Khosla, from Centre for Urban and Regional Excellence spoke about using GIS data for slums
  • Mr. Kapil Mishra, the Vice-Chairman of the DJB spoke at length about how they plan to transform the DJB. Also, he promised all data sharing from DJB’s side.

After a general discussion on various water related issues in Delhi, in the last segment we focused on framing the data problems associated with SAP 2015.

  • Need to think about the water data which already exists.
  • Sundeep will put up a list of people and organisations which have data on water in Delhi
  • A suggestion was made to focus on Gram Sabha level data as well
  • Need to prioritize the issue of water access to all, the missing data on ‘access’ related problems and appropriate mechanisms
  • Some private bodies have been collecting data from GPRS meters, let’s try to open this data
  • Need to map the borewells
  • Need to interpret and understand the data which DJB requires.

To Do list

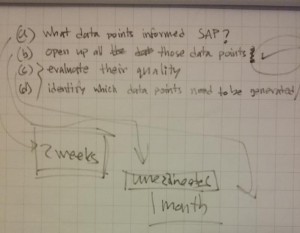
  • We will list out all data sets that have informed the SAP document [Time: 2 weeks]
  • Sundeep will share the data sets already available from DJB
  • Once the list of data sets is prepared by us, it will be submitted to DJB via Sundeep and Kapil, who will then see if the mentioned data sets can be opened up. [Approximate time: 1 month]
  • Once these data sets are available, we will evaluate the quality of these data sets
  • Identify data sets that are missing and the ones that require a better collection process

Resources

We are using a Google spreadsheet to list out all data sets that informed the Summer Action Plan.

We are using HackPad to collect various resources.

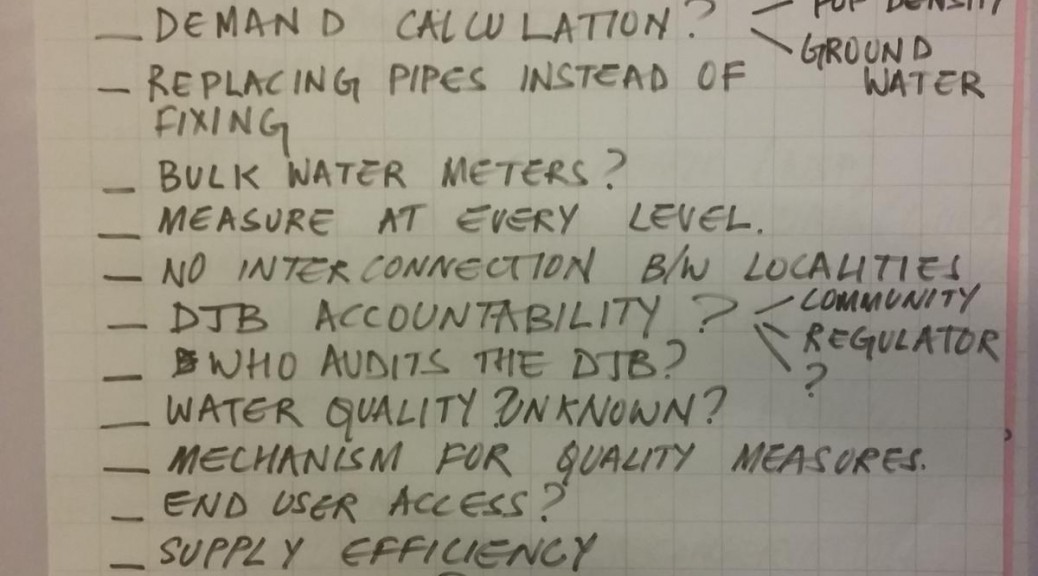
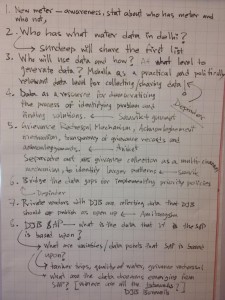
Images of notes takes by Namrata Mehta and Sumandro Chattapadhyay at the meeting:

DataMeet_2015.04.30_DJB_Water_Data_Notes_01

DataMeet_2015.04.30_DJB_Water_Data_Notes_02

DataMeet_2015.04.30_DJB_Water_Data_Notes_03

DataMeet_2015.04.30_DJB_Water_Data_Notes_04

Open Data India Watch – 20

Stories

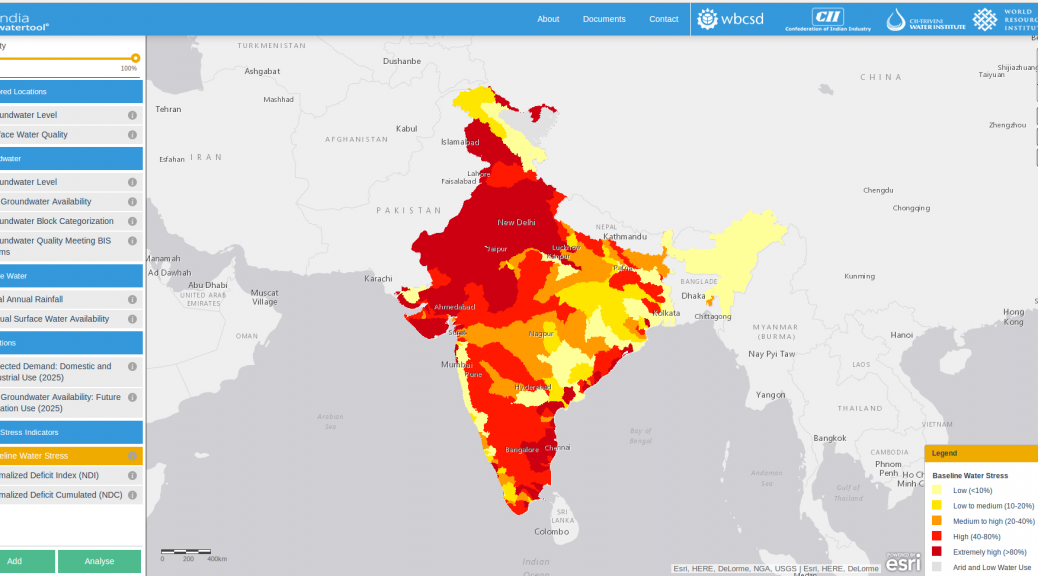
  • The India Water Tool Version 2 (IWT 2.0) is an easy-to-use, online tool for companies and other users to understand their water-related risks and prioritize actions toward sustainable water management. IWT 2.0 combines data from Indian government agencies and water stress indicators from the World Resources Institute and Columbia Water Centre.

Events