Category Archives: City

Data Party! Garbage Go! Update

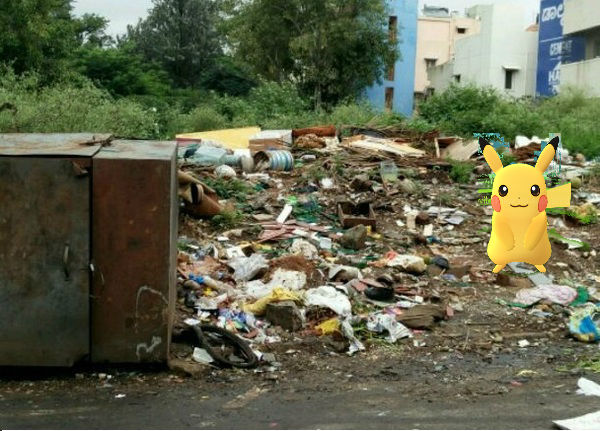
After a week of mapping 1000 spots in Bangalore has been mapped!

screencapture-citizen-co-lab-mapunitygroups-1475391663877screenshot_2016-09-30-15-45-28

We have 50 people who have mapped at least one spot across the city.  The event last Saturday brought together people from different neighborhoods to take a walk and map some garbage.

We hope to be able to double this number and maybe even get to 3000 spots by the 3rd week of October!

If you have some time please download the app and map the garbage spots in your area. You can see the full map and zoom into your neighborhood here. 

To download the app find the links below.

Link to Mapunity Groups IOS app:
Link to Mapunity Groups Android app.
See Read more 

If you don’t want to download the app feel free to send us pictures. Turn on the GPS tag on your camera and then put up your pic on Twitter or Facebook with the Hashtag #garbagego

All data will be made open at the end of the campaign.


RTI Stories: Repost Citizen Matters

Troubles in getting data through RTI.

From Akshatha 

It has been precisely five months since I filed an RTI application with the Advertisement department of Bruhat Bengaluru Mahanagara Palike (BBMP) seeking information about legal and illegal advertisement hoardings in the city. (If you haven’t read the first piece you can read it here). And today as I write this second post about the status of my application, I stand in dismay, even as I continue to struggle to get the information that I am looking for.

In the last five months as I ran around pursuing this RTI application, there have been times when I sat counting the days and hours I spent on this chase. I would ask myself, “is it all worth it? What am I going to get at the end of it?” May be after months of prolonged wait, even if I succeed to get the information, it might just turn out to be obsolete. But then if I stop following it up, I for sure know, the lethargic city corporation officers who shifted their responsibility and did their best to wash their hands off, will continue doing the same in future. –
Read more 

Data Party! Garbage Go!

At DataMeet we have spent years looking for and trying to make data accessible. The last few years more and more data is being made public which we are excited about however people demand data that fills the gaps in data that already exists or that is more actionable. Data that people want and need isn’t being produced, and if it is being produced it isn’t being shared.

This is the most true in urban spaces where there are tons of projects dedicated to collecting data for the city but none of this data enters the public domain as open data. It isn’t public data because the government doesn’t collect it and the various governance and civic oriented groups who collect the data are more prone to write reports or put the analyzed data up online and not the usable and complete raw data.

So DataMeet along with Oorvani Foundation and Mapunity want to start a monthly Data Party! Where we pick a topic and try to collect as much data as we can over a month. Then we will make the data open for download on OpenCity Urban data portal and also send it to the appropriate person in the government, as well as, write data stories on Citizen Matters.

So please join us on Sept 24th to kick off the first ever Data Party! Garbage Go! 

There are an estimated 9000 garbage blackspots in Bengaluru. We are trying to catch them all!

Sign up to map your neighborhood everyday. Or join us for chai and snacks on Sept 24th and map with friends in 3 locations: Koramangala, Indiranagar or Frazertown.

You have to register and download the app so we can plan for the snacks.

Event location will be sent to you once you register.

Time is 9:30am to 12:30am – Sept 24th Saturday morning.

9:30am – Intro and app explanation
10 to 12 – Mapping
12 to 12:30 – Closing and Next Steps.

All data collected will be made open on the OpenCity.in Urban Data Portal for download and use, and this data will be sent to the BBMP and followed up on.

Indirangar – Maanya – Meeting place MapBox India

Koramangala – Nitin – Meeting place Sagar Fast Foods behind BDA complex

Frazertown – Contact Nisha Thompson – Meeting place French Loaf by Richards Park.

Register here.

Download the app and get mapping.

Link to Mapunity Groups IOS app:
Link to Mapunity Groups Android app.
SeeRead more 

Data Policies in Telangana

Government of Telangana  has launched four IT policies related to data on cybersecurity, data centers, data analytics and open data. Honorable IT Minister K T Rama Rao has announced the intention of separate sectoral policies through the launch of Telangana IT policy in the month of April’16. During the launch he stressed the importance of open data policy for the state. In his own words:

” Telangana will be among the pioneers in the country in coming up with this open data policy. The open data policy is the first step in opening up government data to a host of potential applications. The policy sets the necessary framework in place to operationalize the state open data portal. The policy has many enabling provisions in place for multiple stakeholders. Through this policy we hope to catalyze data and to make data driven decision making possible and development of important solutions for societal benefits. “

These policies were made after several consultations with industry, academia, civil society and various individual experts. Though the policies focus on individual sectors primarily, most of the elements are inter-linked with the common element of data.  While the state government intends to foster its economy and business with the help of data, the open data policy focuses on enabling transparency and human development apart from economic development. Telangana, an IT rich state following open data practices will be a major boost for the ecosystem in India too.

We have been interacting with officials from Government of Telangana since December ’15, providing appropriate suggestions for the open data policy. Dileep Konatham, Director for Digital Media, Department of Information Technology was our esteemed panelist during discussions on Digital India at Open Data Camp Delhi ’15.  Datameet will work with the Government of Telangana to help implement the policy with necessary suggestions for guidelines and community building over the coming months.

Links to the policies launched:

BMTC Intelligent Transportation System (ITS) and need for Open Transport Data

Bangalore Metropolitan Transport Corporation (BMTC) has recently launched its Intelligent Transportation System (ITS) in May’16. First announced in 2013, this was one of the systems most data enthusiasts in urban transport were eagerly waiting for. The system was designed to scale on paper and BMTC made sure the data rights of data being generated are with them instead of the contractor. Even with extreme planning, the system was delayed by 2 years and has several issues with it. Some of these issues have been highlighted to BMTC by members of datameet’s transport working group with suggestions to make it better in early June.  Along with the suggestions we had several questions regarding the project, we have asked BMTC to help us understand the ITS system in a better way and expressed interest to be part of the Evaluation & Monitoring (E&M) of the ITS project.  It is important that the project is closely monitored to improve public transportation for Bengaluru.


We also shared some of the previous work carried out by members of the group and suggestions to use open transport standards like GTFS, usage of openstreetmap data to reduce maintenance costs for currently using third party services like Google Maps which is not entirely free.

Members of datameet have been working on transport data of BMTC since 2010. Thejesh GN hosts static data of routes and schedules  of various years through his project OpenBangalore.  As a community of researchers, data users and enthusiasts we have been studying and experimenting with the evolution of data practices in India. Open Data is helping us be aware of our surroundings and also contribute back to the city in our own way. BMTC’s ITS implementation is a opportunity for most of us, we can potentially use GPS data to understand traffic patterns, rash driving of bus drivers, skipping of bus stops and trips. The ITS system will help the commuters more than ever if being utilized the right way. Open Data can help make this dream a reality by letting any commuter analyze his ride. Officials of BMTC has made announcements of bringing up a data sharing policy on the lines of National Data Sharing and Accessibility Policy (NDSAP). In this regard we requested them to host a public consultation for their draft data sharing policy. We hope we can help BMTC and Bengaluru in a better way by bringing a policy suitable for all commuters and not just data users.


Open Data Camp 2016: Pollution Party! Full Schedule

REGISTER TODAY! We have reached capacity but have left it open for today. If you are not registered you won’t be able to join as Google security is very strict and will require you to be on a list.

Day 1: Pollution Party!

9:00am – 10:00am Registration
10:00am – 10:15am Introduction to OpenDataCamp
Team DataMeet
10:15am – 10.55am Karnataka State Pollution Control Board
By Dr Nagappa, Scientific Officer
11:00am – 11:10am Tea Break
11:15am – 12.00PM Environmental Support Group
12:00pm – 01.00PM Water Dr. Priyanka Jamwal
Environmental Researcher who currently is a fellow in ATREE. Her work focuses on identification of contaminant sources in surface water bodies, modeling the fate and transport of contaminants in urban hydrological systems and assessing the risk to human health due to exposure to contaminants.
01:00PM – 02.00PM Lunch
02:00PM – 03.00PM Pollution Data Collection Demos
Sensors without Borders, IndiaSpend*, Hindustan Times, YUKTIX – Open Weather Network Bangalore, India Open Data Association
03:00PM – 03.15PM Tea Break
03:15PM – 03:45PM Getting to 12 PM 2.5 | Setting the context for Action!
Sensing Local is a Bengaluru based do-tank focused towards making cities healthier, safer and more inclusive. The studio is working in partnership with Anti Pollution Drive (APD) Foundation, Mangalore towards a collaborative project on tackling air pollution. (https://sensinglocal.wordpress.com/
03:45PM – 04:45PM Urban Emissions
By Sarath Guttikunda
04:45PM – 05.30PM Group conversation and planning session on response to Geospatial Information Regulation Bill 2016
By Volunteers of SaveTheMap.in
05:30PM – 06.00PM Closing Remarks and Plans for Day 2

Pollution DEMO HAPPY HOUR!

Mapbox Happy Hour, 6p to 9pm. Puma Social Club, 100ft Road, Indiranagar. Bring your badges!

Day 2: Action Party!

“Hardware Hello World” for children.

A video posted by Thejesh GN ತೇಜೇಶ್ ಜಿ ಎನ್ (@thejeshgn) on

Sign your kid up to learn how to build environment sensors.

Sensor workshop poster

It is also a free day for people to demo, share and work on any projects they want!

Huge thank you to our sponsors!

Sponsors

http://juxt-smartmandate.com/project/india-open-data-association/

12 DAYS TIL 2016 Bangalore Open Data Camp: Pollution Party!

DataMeet will be hosting the 5th Bangalore Open Data Camp: Pollution Party on May 14th and 15th.  This year we want to spend time and look at the growing problem of pollution by spending two days examining the role of data. Last year saw a major turning point in the debate around pollution. Indian cities became a major focal point, as proof that New Delhi has worse air quality than reigning champion Beijing was proven with data. This put a spotlight on air pollution problem across India. At the same time water pollution from industry has also come up in the foaming lakes and rap videos fighting for recognition of pollution and its effects on people. The economic and development growth has meant that the building industry has been in over drive bringing sand and dust into urban and peri urban areas in large quantities plus the growing lack of proper trash disposal has had major health implications for people from all social economic backgrounds.

However, the actual exposure of pathogens and pollution is not well known, extensive data has not been made available or is being collected in a way that can’t be easily understood or acted upon. This has spurred the rise of data collection networks and agencies to fill this gap. In every major city citizen supported cheap sensor devices have been put around cities to add data to the small number of official government monitoring stations.

This year at Open Data Camp we want to explore the role of these data collection network in a growing citizen and private sector monitoring role. What is the role of open data? When these networks grow can there be agreement on standards and formats to be maintained? and Are there financially sustainable solutions that can be built on open data?

Notably Karnataka State Pollution Control Board is attending to give the keynote in the morning and hopefully bring some data with them for us.

Tentative Agenda

1) Karnataka Pollution Control Board

2) Environmental Groups to give the general ecosystem around enforcement

3) Data collection networks
Sensors without Borders
IndiaSpend*
Hindustan Times*
YUKTIX – Open Weather Network Bangalore
India Open Data Association

4) Water Pollution
Ground water
Urban lakes

5) What you can do with robust data?
Urban planning
Transport
Modeling for enforcement.

6) Open Environmental Formats and Information Discussion

Day 2

We will be hosting a sensor workshop for kids http://odc.datameet.org/sensor_workshop

Sensor workshop poster

We’d like to thank our sponsors Google, Sensor without Boards, India Open Data Association, Oorvani Foundation, and partner Reap Benefit. If you would like to sponsor or get involved please contact me @ Nisha (at) Datameet.org

Open Access Week 2015

Late post

Open A20151024_190330ccess Week is used as an opportunity to spread awareness of open access issues throughout the world. It was Oct 24th to the 30th last year. Shravan and Mahroof from the Ahmedabad Chapter suggested we do the first every multi city hangout and bring together different groups working on openness issues throughout the country.

For the event we had a Google Hangout with:

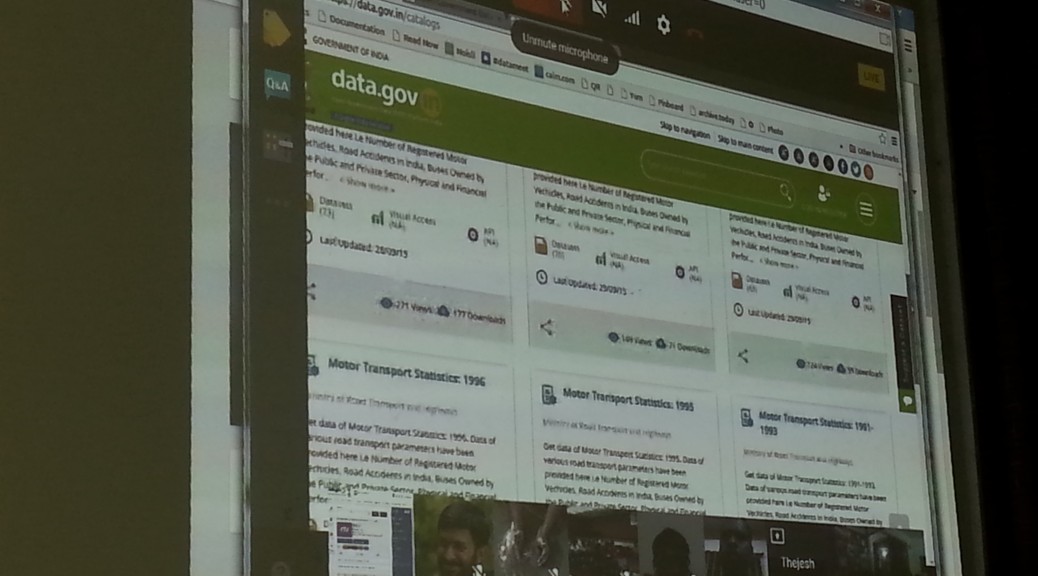
Data.Gov.In started us off with  Alka Misra and Sitansu participating from Delhi. They spoke about new features on Data.Gov.in, new datasets and visualizations available. They were also there to extend invites for more participation from the community.

Rahmanuddin from Access to Knowledge then spoke about Wikipedia and their community dedicated to local language knowledge sharing. They also had pertinent questions to Data.Gov.In regarding using open licenses. Since Wikipedia can’t use any data from Data.Gov.In since a license isn’t specified.

Ahmedabad Chapter went next. Ramya Bhatt, Assistant Municipal Commissioner from Ahmedabad, came and gave a brief talk about their plans for open data and smart cities. Alka from Data.Gov.In offered assistance. Then some students from Dhirubhai Ambani Institute of Information and Technology’s machine learning program used some data from Data.Gov.in to do analysis at the event. They looked at high budget allocation per state and drop out rates.

Open Access India’s Sridhar Gutam briefly went through the plans OAI has for the upcoming year to promote open access science and journals.

Hyderabad DataMeet is a new and yet to really take shape meet up but we were happy to see a first attempt. Sailendra took the lead as the organizer and brought together some people from IIM Hyderabad. Srinivas Kodali was there to talk about all the data he had made available that week.


20151024_184755Banalore DataMeet was there to share what has been going on with DataMeet and any new iniatives in Open Access


It was a great event, and as with all online events there were some technical difficulties but everyone was patient. It was awesome to see how the open culture space has grown, and to see so many new DataMeet chapters.

You can see the event below:

I hope we do one again soon minus the technical difficulties.

Analysing Bangalore’s Bus Network

Open Bangalore has been a pioneer in opening up several data sets that help understand Bangalore city. This includes the network of Bangalore Metropolitan Transport Corporation (BMTC). The BMTC operates over 2000 routes in the city and region of Bangalore and is the only real mode of public transit system in the city. Some of us at DataMeet took to time understand its network better by performing some basic analysis on the gathered dataset. The data set had bus stops, routes and trips. We inspected frequency, coverage, redundancy and reachability.

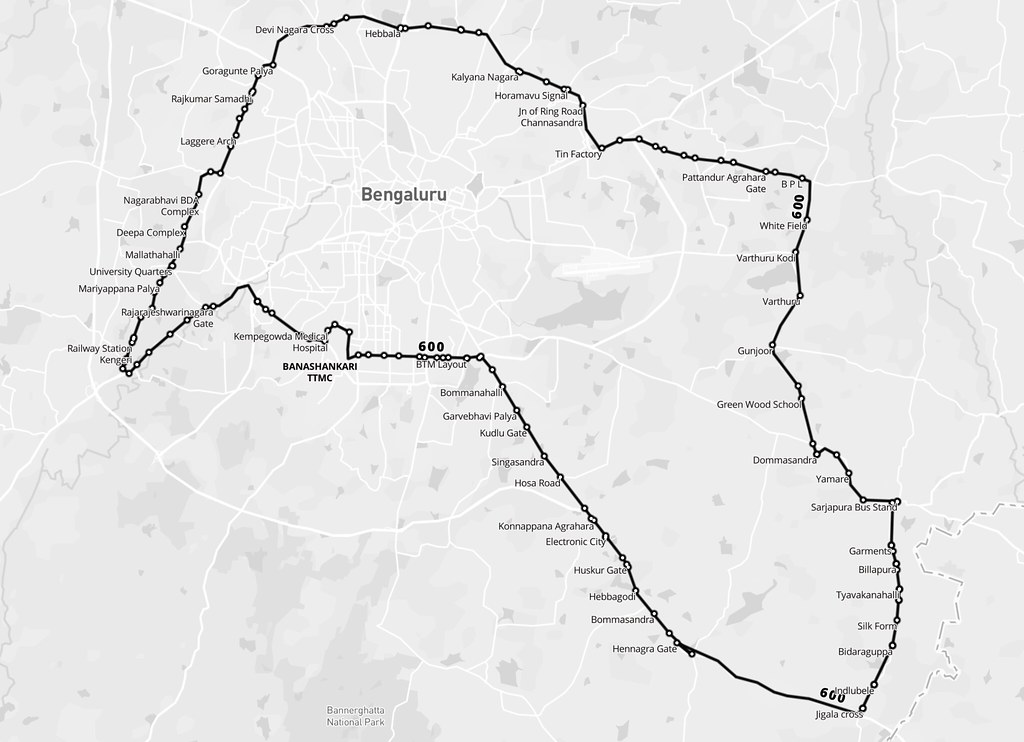
Longest route

BMTC is known for its many long routes. Route 600 is the longest, making a roundtrip around the city, covering 117 km in about 5 hours. There are 5 trips a day, and these buses are packed throughout. It should be noted that while the route traces the edges of the city in the west and north, it encircles the larger industrial clusters of the east and south.

View the map full screen.

Frequency

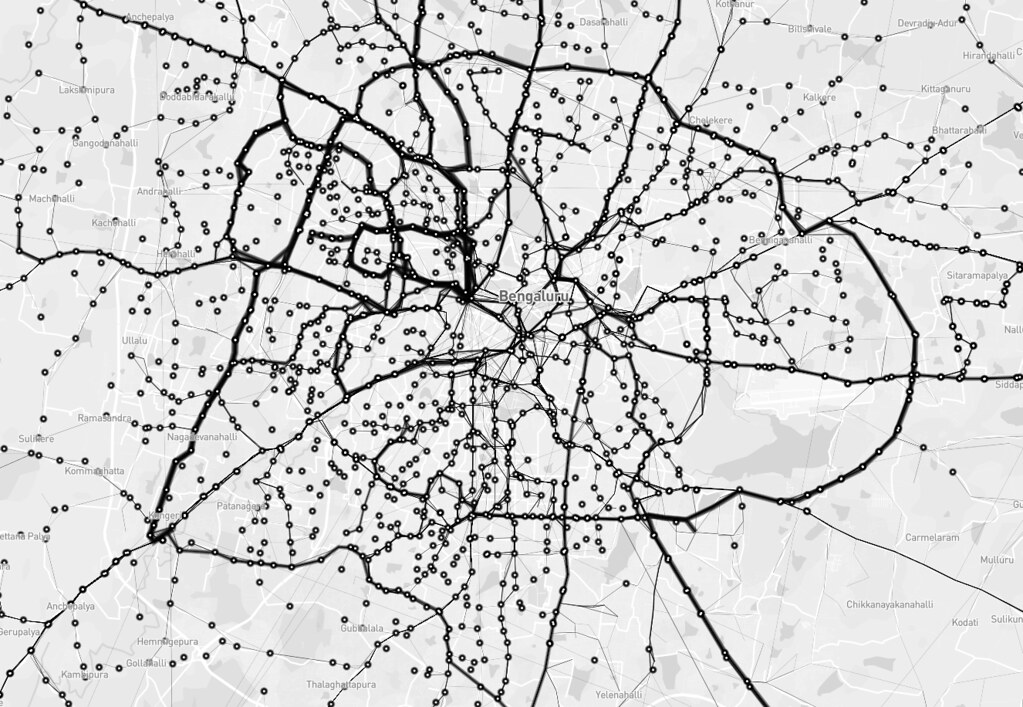
Next, I wanted to look at the frequency of different routes. In the image below, stroke thickness indicates how many trips each route makes. The relationship of the bus terminals with neighbourhoods and the road network can be easily observed. For instance, the north and west of the city have fewer, but more frequent routes. Whereas, the south has more routes with less frequency. Also, nodes in the north and west seem to rely more on the trunk roads than the diversely-connected nodes in the south. One can easily trace the Outer Ring Road, too.

View the map full screen.

Reachability

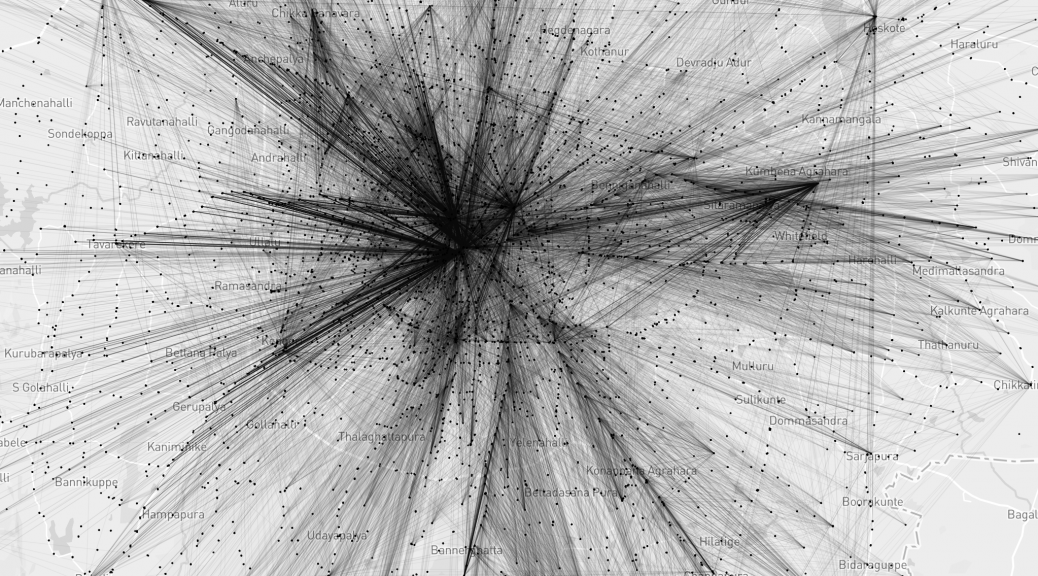
I tried to define reachability as destinations one can get to from a stop without transferring to another bus. The BMTC network operates long and direct routes. The map shows straight lines between bus stops that are connected by a single route. The furthest you can get is from Krishnarajendra Market (KR Market) to the eastward town of Biskuru: roughly 49 km as the crow flies.

View the map full screen.

Direction

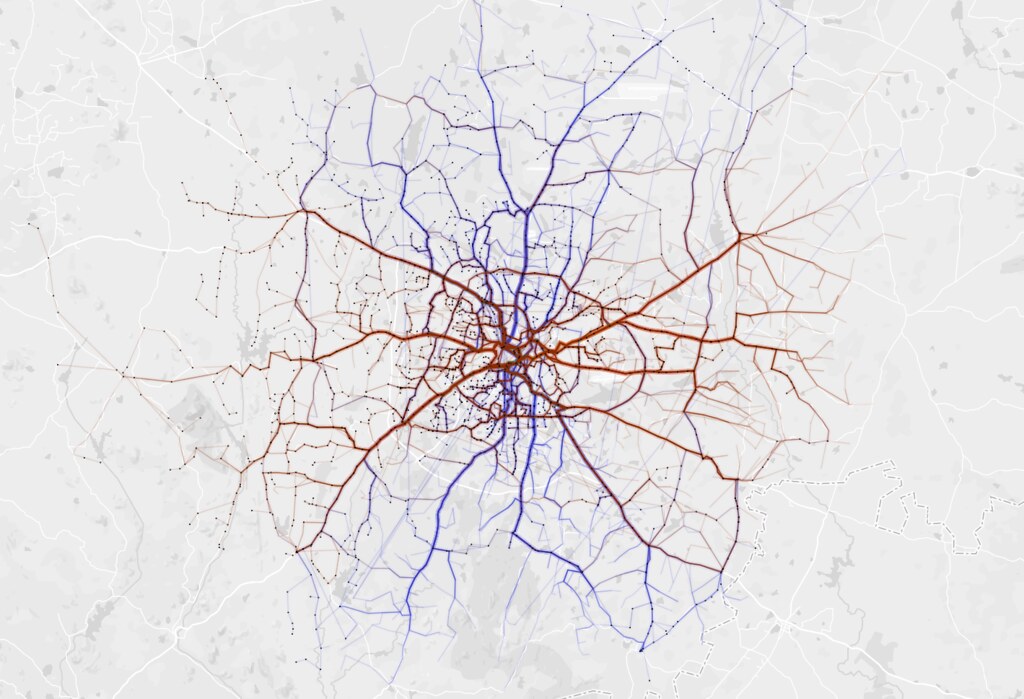
Which directions does BMTC run? It is interesting that BMTC covers the city North – South (blue) and East – West (brown) with almost equal distribution.

View the map full screen.

Coverage

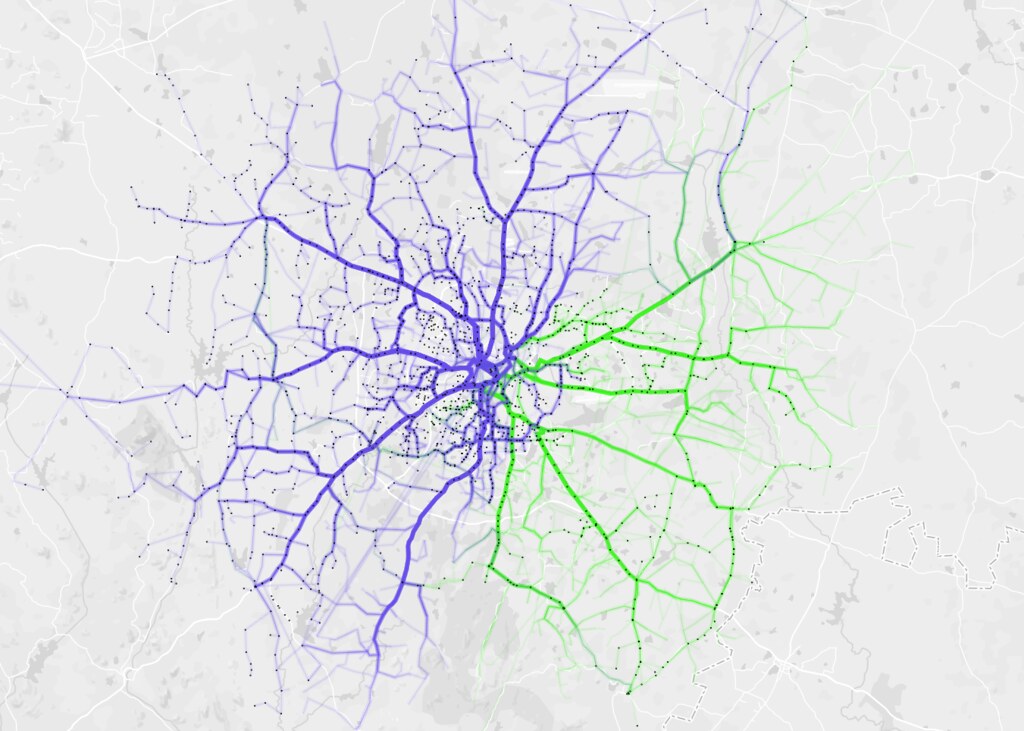
BMTC routes are classified into different series. Starting from 1 – 9 and A – W. I analysed coverage based on series 2 (blue) and 3 (green) and they make up almost 76% of the entire network.

View the map full screen.

Redundancy

Tejas and I took turns to try and figure out the redundancy within the network. Redundancy is good to absorb an over spill of bus commuters. Redundancy is a drain on resources and makes it hard to manage such a vast network with efficiency. So, we looked at segments that overlapped different bus routes.

View interactive map.

Node strength

This map by Aruna shows node strength – number of routes passing through a particular stop. You can see that the strength decreases as we move away from the city center with the exception of depots.

View interactive map.

Just like the data, our code and approach are open on Github. We would love to hear from you, and have conversations about the visualization, the BMTC, and everything in between!

DATA{MEET} PUNE, 5th Meetup – Roundtable

-article by Rasagy Sharma

On the 16th of January, we hosted the fifth Datameet event for the Pune chapter at the Symbiosis School of Economics. The focus in this event was more on enabling discussions and initiating collaboration, so a Roundtable format was selected with three main speakers: Padmaja Pore from Door Step School, Jinda Sandbhor from Manthan Adhyayan Kendra and Nikhil VJ (Centre for Environment Education).

The session started with everyone introducing themselves. After that, Craig — co-organizer of the Pune chapter — talked about what Datameet is, how it started, and the aim of city chapters. He then explained how the Pune chapter is focused on connecting data-enthusiasts from various disciplines — such as NGOs, Data Analysts, Engineers and Designers — to help collaborate and spread more awareness about how data can be used.

Every Child Counts – Education of migrant children

The roundtable started with Padmaja Pore introducing Door Step School, an NGO that runs several projects around primary education. One such project is Every Child Counts (ECC) that was started in 2011 and focused on ensuring that  every child goes to school at the right age of 6-7 yrs. Through ECC, Door Step School seeks to understand and address barriers  to the schooling of kids of migrant communities such as those engaged in nomadic professions,workers at construction sites, factories, brick-kilns, etc. in the vicinity of Pune city.  When parents move their home several times in a year itself, how can it be ensured that their kids remain enrolled in schools?

In India, there are more than 1 million kids out of school (18 million in Southern Asia and 69 million globally). The Right to Education Act has ensured that free and compulsory education is available, but no systematic process of finding and enrolling out-of-school not been actively implemented, with no definite count of the number of migrant children denied education. Surveys have been focused on children already working/street children, whereas the need is to focus on children who are 6-7 years old so that they are enrolled into schools before they get drawn into employment. There have been no active steps to put in processes at schools for ensuring migrant children can transition smoothly to another school when they migrate. .

The ECC Project has the following Implementation Methodology, which is volunteer driven

1. Surveys: Volunteers conduct surveys of construction sites in partnership with NGOs
2.Preparatory camps: Through the medium of preparatory camps, awareness is spread amongst parents of children on the importance of schooling. After working with the children, the team realized that these kids are not aware about the concept of formal education, and are not used to sitting at one place for a few hours to study. Thus the focus in the preparatory camps is on interactive activities to get kids more accustomed to the environment.
3.Admission/ Enrollment: The children and parents are accompanied to a local public school and assisted with the enrolment process. Parents are made aware of the provisions of the RTE act.
4.Support and Follow-up: Arranging transport to school wherever needed, tracking attendance and addressing reasons for non-attendance

The ECC project is currently running in Pune, Pimpri Chinchwad, Fringe areas of Pune & Nasik. The project uses various types of data:

  • Unified DISE data on schools, which is comprehensive but lacks spatial aspect
  • Crowdsourced spatial data of public schools
  • Spatial data of construction sites – Both crowdsourced and taken from real estate portals & builders websites
  • Spatial mapping of volunteers in the field
  • Children at each construction sites, spotted by volunteers and NGO staff

Data sources: http://schoolreportcards.in/SRC-New/ & http://www.dise.in

Currently the data is collected using a mobile app based on ODK (Open Data Kit) & KoboToolbox/ONA. The team is developing a Web based Platform for scaling the ECC Program pan-India and engaging NGOs and CSR groups in this cause. One of the key features of this Website is envisaged to be to engage volunteers actively with children to help motivate, enroll and track their continuity for larger impact.

Challenges

Padmaja then talked about the way forward and the challenges they were facing w.r.t developing the ECC Platform as well as actually reaching all children in the project areas.

  • No formal source available for school locations, hence data is still partially incomplete and dependent on crowdsourcing of school locations.
  • Need a systematic way to predict locations of existing and future construction sites to find migrant labourers.Set up an ERP like system to record a child’s details, so they can be tracked after migration as well
  • Create a mobile friendly website for the Platform
  • Create more interactive maps and chart visualizations, showing schools, sites etc (heatmap or other suitable format) for providing an aggegation/ disaggregation of data on migrant children. This can help in advocacy efforts.
  • Explore ways to track migrated children Find ways to dynamically update the databases and see changes in map/chart visualizations after a volunteer makes an entry on the mobile survey form.

After the talk, everyone pooled in with their ideas and suggestions such as connecting with Trekking communities to pair up as volunteers to reach out to any schools/kids on the outskirts of the city, and collaborating with initiatives like Sagar Mitra (Recycling plastic). Few problems were taken up by individual attendees for further discussions, like finding ways to automate the data entry into excel which is done manually right now. Interested attendees were requested to volunteer and also reach out to their community to spread the word.

Village level Mapping

IMG-20160120-WA0000

For the second talk, Jinda Sandbhor from Manthan Adhyayan Kendra spoke about village level mapping of tanker water supply in Maharashtra. With 14,708 drought affected villages in 2015 and 148 drought prone blocks, there is an immediate need for collecting data to analyze the reasons for drought and what can be done to better prepare for the future.

Most villages facing drinking water shortages due to lack of piped
water supply or lack of drinkable ground water. For such villages,
there is a tanker water supply from the Maharashtra government. The shortages are most severe just prior to and during the monsoon, some of these villages get return (North East) monsoons which reduces the demand of tankers by the end of the year. Jinda showed some aggregate data that has been collected that shows blockwise, the number of villages requesting the tanker supplies during
various months in the past few years.

There are multiple reasons for the demand of tankers:

  • Less rainfall & resulting drought is the main reason
  • Anthropogenic contamination of ground water
  • Dumping of mine water into the river

Challenges

Jinda highlighted his efforts to collect village specific data in some districts on the reason for request of the tanker. He mentioned that there is need for a village-level base map for Maharashtra that can help visualize and analyze this issue.
The discussions after this talk were focused on GIS related topics, with everyone agreeing for the need for detailed village level maps. While there are village level maps available in PDF as well as as a Web Map Service by Bhuvan, these need to be converted into shapefiles so they can be used for further analysis. This will enable visualizing with great accuracy, not just drought related data but any number of socio-economic parameters of Maharashtra for analysis.

It was also recommended to connect with Prof. Ashwini Chhatre from Indian School of Business (ISB) who has been working on Millets & Irrigation data and would have more detailed maps of the state. Another suggestion was to use GIS to take Land Revenue maps and convert into public-domain data.

Tools for participation in city governance
IMG-20160120-WA0001

The third talk was by Nikhil VJ who is the co-organizer of the Pune Datameet chapter and has been working on multiple data-centric projects. He also showed his work on cleaning and mapping Pune’s Budget sheet, which was originally available as a 600 page PDF and now has been converted to excel and cleaned up considerably. The Pune Municipal Corporation has now agreed to bring in some reform in its budget book format and Nikhil & CEE are working on possible ways to take such tasks forward. Nikhil also covered several tools and methods described below that are easy for anyone to pick up and can help solve some interesting data-related problems.
Some of the resources mentioned by Nikhil were:
The newly launched website www.sahbhag.in — Participatory Urban Governance in Pune
nikhilvj.cartodb.com — Maps & Datasets of Pune posted online by Nikhil
www.crowdcrafting.org — Collecting & mapping of data with the power of crowdsourcing
Localizing Pune’s budget data by Nikhil & other volunteers:
http://crowdcrafting.org/project/localpunebudget
Map form — An experimental method that Nikhil has craeted to collect location data using WordPress plugins
www.mapwarper.net — Using maps that are currently as an image to wrap on
an actual map

With this, the session was formally concluded.