Nepal Needs You to Make Maps!

Post by Tejas AP

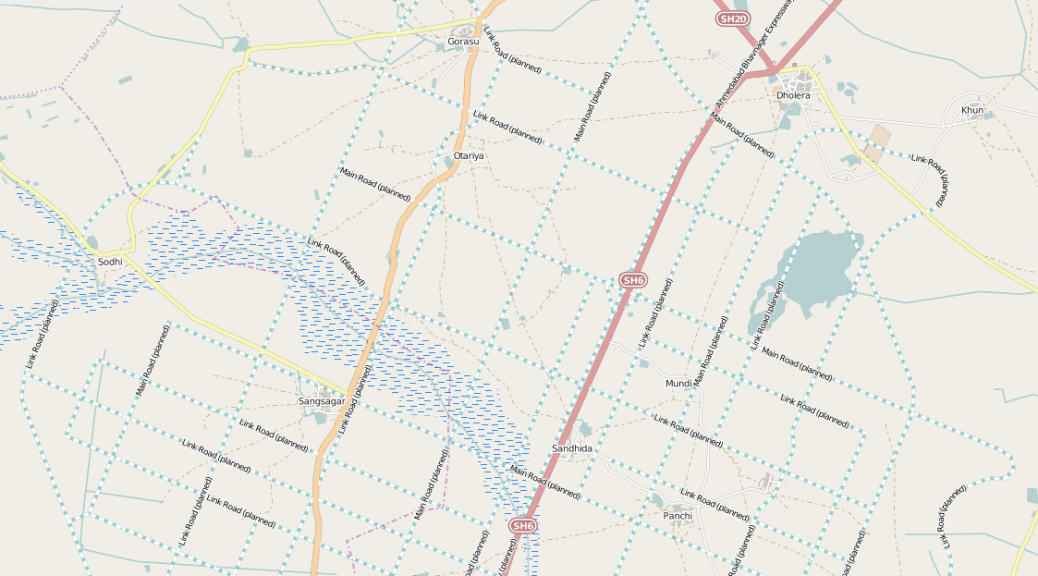
The Humanitarian OpenStreetMap Team (HOTOSM) has activated to support crisis response in Nepal after the recent devastating earthquake. A global team of volunteers is contributing to the OSM project by mapping physical infrastructure (roads and buildings) as well as traces and areas safe for crisis responders to use and congregate at. We believe improved information, especially of the remote affected areas, is crucial to improve the efforts carried out by relief agencies on-ground.

Volunteers may contribute to the map of Nepal simply by selecting a task from the wiki. Basic questions about registering and using the OSM mapping tool can be found in its comprehensive documentation here.

While the volunteers have been recording road networks and buildings at a rapid pace, we understand that the communication networks in Nepal are still being restored, and crisis responders might not have access to navigation maps to expedite their efforts. We want to help in ensuring that people have access to map data in every manner possible.

We want to print offline maps and send them with relief materials from India to Nepal. Please help us by providing us

* a list of towns/villages/regions you need maps of, and

* point-of-contact we can deliver the printed maps to.

For more information, please get in touch with

Sajjad  – sajjad(at)mapbox(dot)com

Tejas  – tejaspande(at)live(dot)com

Nisha  – nisha(at)datameet(dot)com

Prabhas – prabhas.pokharel(at)gmail(dot)com

Meanwhile, here’s some information that you might find useful  –

1. https://www.mapbox.com/blog/nepal-earthquake/
2. The News Minute report –
http://www.thenewsminute.com/article/how-group-individuals-all-over-india-are-making-maps-help-rescue-teams-nepal
3. HOT Wiki – https://wiki.openstreetmap.org/wiki/2015_Nepal_earthquake
4. KLL report – http://kathmandulivinglabs.org/blog/

Francesca Recchia on Redressing Geopolitics

Among other goals this year for GeoBLR, we want to engage conversations that drift away from technical details of making maps and working with spatial data. In March, we featured Francesca Recchia to talk about geopolitics.

lbok

Francesca is an independent researcher and writer who has worked and taught in different parts of the world, including India, Iraq, Afghanistan, Pakistan, Palestine. She is interested in the geopolitical dimension of cultural processes and in recent years has focused her research on urban transformations and creative practices in countries in conflict.

Francesca spoke about her work in Kabul over the last two years around the Little Book of Kabul – exploring cultural practices by following Kabul’s own artists. Geographical and political borders and the construction of geopolitical imaginations have a profound impact on the way people think about and define themselves. She drew stories out of Mappa Mundi and Alighiero Boetti trying to connect how they reflect the geopolitical transformations of the world.

geoblr-francesca

Francesca says that the only way to understand politics and geopolitics and what this means for people in areas in conflict is to be amidst of it. This, she thinks is why one should work with artists and photographers.
Photos by Lorenzo Tugnoli

{Ahmedabad} – First Meeting

Data{Meet} Ahmedabad chapter was initiated on 7th March 2015. 25 souls attended the first meeting. The venue was SAATH Charitable Trust.

The meeting started with an introduction of the organizers, and a quick round of introductions from the attendees. We had a mix of students, researchers, professionals, and entrepreneurs. The idea and importance of a community built around open data, as we at Data{Meet} represent, was described to the members. Shravan and Mahroof, co-organizers of the chapter, shared the brief history of how Data{Meet} came to be, and how Thej and Nisha were instrumental in initiating the community.

20150307_192403

Shravan gave a lightning presentation about community mapping using OpenStreetMap and briefly explained the editing features. Apart from OSM, Shravan was also found promoting {;-)} mapbox. Aditya (the third organizer) shared a few Infographics on sanitation in India, the Indian railways, and the military capabilities of Asian countries that he created at Folo (folography.com).

The meeting itself was quite active, with people wanting to know more about how we as a community would work, what platforms we would use, privacy issues, possible data applications for Ahmedabad etc. Arun was eager to know whether OSM could be used to map customers privately. Mahroof mentioned the data initiative of the Indian government data.gov.in and how some additional work is needed to bring all the disparate data for them to be more useful to the public. There was a general agreement that lots of data is available from various sources, but not in an easily usable form. Some discussion also happened around voters ID, Adhaar, the Social Security number of USA, and the possible privacy issues. We ended up discussing various issues for about 2 hours, until we closed at 9 PM. For a first meeting of strangers, our event was a huge success with small discussions happening even after the meeting was formally closed. Everyone was urged to join [email protected] .

We had shared a form with DMers to collect ideas for future activities of D{M}Ahmedabad. Suggestions have come for conducting data workshops, and apart from opening up data, using data in some way to help decision making. It was also suggested to have sessions for people who are not well versed in data technology to learn from. I guess we are looking ahead for some interesting workshops and data parties. A few members have indicated that they could conduct sessions in future meetups. Gentlemen, we will be knocking your doors soon !

On another note, the group was almost entirely made of men, with just three women in attendance. Thank you Vishakha, Tanushree and Bhuvana for joining. We hope that our next meetup will have more of you.

A big thanks to Mr. Niraj Jani for agreeing to host us at SAATH, and for the tea. Thank you Aditya@Folo for bringing us yummy samosas.

Please stay tuned for our second meetup in April !!

Open Data India Watch – 20

Stories

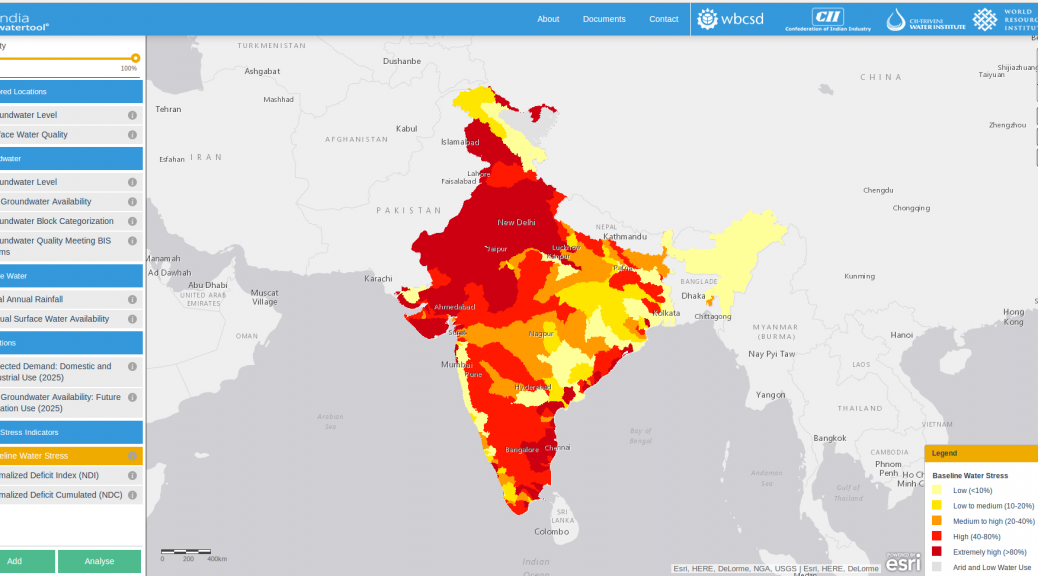
  • The India Water Tool Version 2 (IWT 2.0) is an easy-to-use, online tool for companies and other users to understand their water-related risks and prioritize actions toward sustainable water management. IWT 2.0 combines data from Indian government agencies and water stress indicators from the World Resources Institute and Columbia Water Centre.

Events

Open Data India Watch – 19

Stories

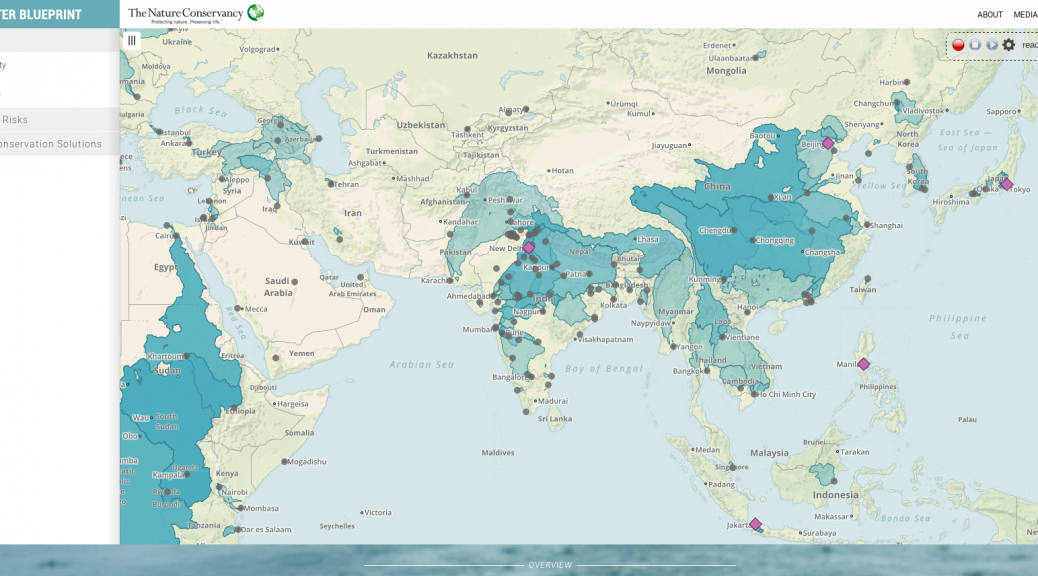
  • Urban Water Blueprint the state of water in more than 2,000 watersheds and 530 cities worldwide to provide science-based recommendations for natural solutions that can be integrated alongside traditional infrastructure to improve water quality. City and utility leaders who embrace both natural and engineered water infrastructure will not only meet future water demand; they will reshape our planet’s landscape for the better.
  • SoilInfo – soil data android app – SoilInfo provides free access to soil data across borders. SoilInfo is also available as a Desktop version.
  • Weather Web proves that Jayanagar is hotter than Hebbal
  • outbreaks by globalincidentmap
    outbreaks

Tech

Events

Olacabs at GeoBLR

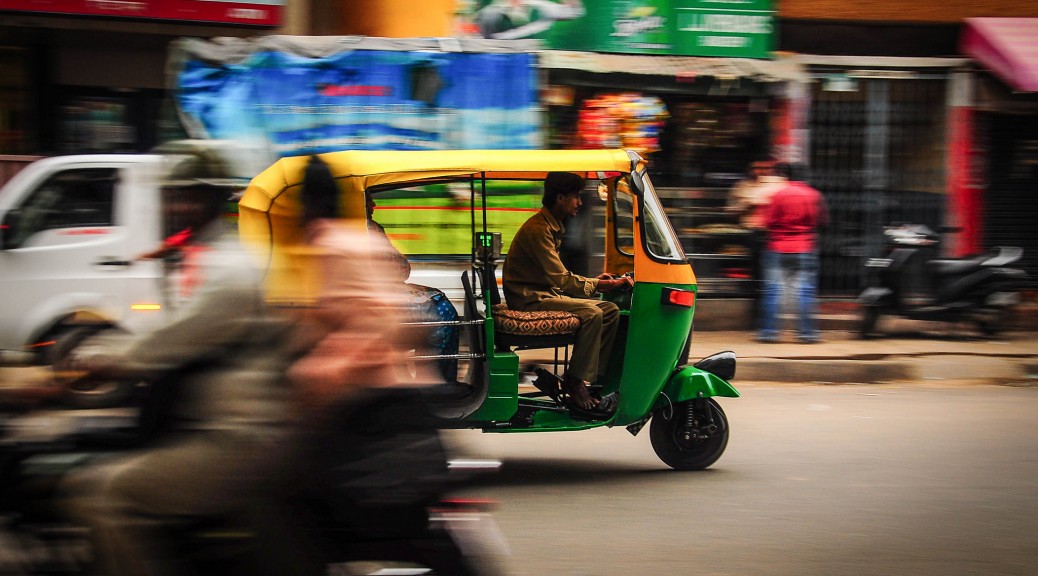
Last week, we gathered at the Paradigm Shift cafe in Koramangala, to learn about the location data infrastructure at Olacabs.com. The meetup was particularly interesting in the light of Ola’s recent move adding autorickshaws to their offering. Location is at the center of Ola’s business.

Vijayaraghavan Amirisetty, Director of Engineering at Olacabs, introduced how they collect data in real-time from cars fitted with smartphones. With over a lakh vehicles online at any given time, Ola’s primary challenge is to build an infrastructure to allocate taxis to customers quickly and reliably. Vijay highlighted some of the issues around collecting location data via GPS and cell networks. Even though both the technologies have matured since their inception, they are highly unreliable in various scenarios. Ola uses a combination of algorithms to build a reliable layer over GPS and network. One thing to note is that the smartphones are of variable quality and the system needs to work regardless of these metrics.

olameetup

Even though Ola is using Google Play services as their location aggregator, in India, network is a bigger challenge. Quality varies from city to city and also reception within a city in unpredictable. Ola falls back to SMS, driver’s phone and a set of offline algorithms if the network is unavailable. Ola’s infrastructure is built using technologies like MongoDB, MySQL, Cassandra, Redis and Elastic Search. They are also exploring integrating web sockets and an experimental custom Android mod.

There was a lot of feedback from the audience specifically around why it is difficult for the drivers to locate the customer. Driver training is not an easy task – there are a lot of logistical and operational challenges. Vijay emphasised on the amount of work Ola does to improve the drivers’ experience with the whole process of on-boarding their cars.

Everything at Ola is realtime – why would anyone book an auto through Ola if they can just walk out and get one in less than a minute. They are continuing to improve and innovate to revolutionize transportation in Indian cities.

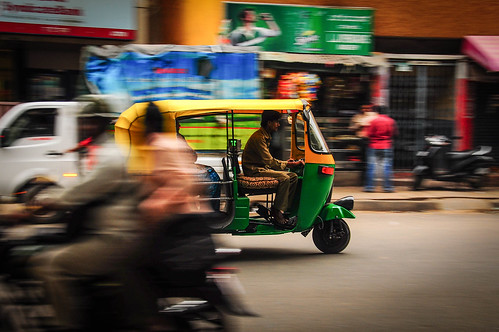
Autorickshaw photo CC 2.0 Spiros Vathis

{Delhi} Jan 28th Planning Meeting

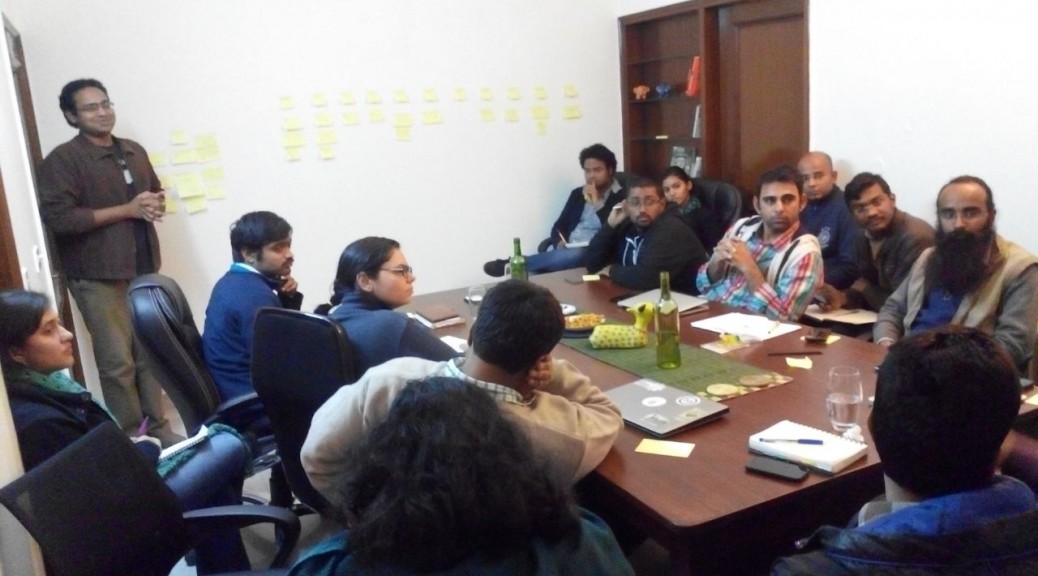
Delhi DataMeet – Jan 28th

IMG-20150128-WA0005

On the 28th of Jan Delhi DataMeet met to discuss their plans for the next year and to pick new organizers since Sumandro is leaving Delhi.

  • Nisha then summarized what was happening with DataMeet central and the other chapters.
  •  Amitangshu – when you think of DataMeet we think about through the sector we work in.  How does translate to the overall goal and become a common idea to all of us?
  • Updates on NIC
    • NDSAP Cell new’s head BN Satyapati
    • Data.Gov.iIn team is the team that is managing MyGov.in – resources have been moved to MygGov – can we push mygov to do open data things?  People have to suggest open data activities on MyGov.in.  Something we can do?

We started out with introductions and with the following questions.

  1. What should be the purpose of DataMeet Delhi?
  2. How can DataMeet Delhi add value to your own work?
  3. What activities/events should DataMeet Delhi do during the next year?

In order to find out the answer to the above questions post it notes were passed out and people were asked what they thought the purpose of DataMeet Delhi should be and what activities do they want to do in the following year.

delhidatameet

Purpose/Value

  1. awareness and knowledge about the global movement of open data – nuances/ policy/politics
  2. open data advocacy intervention in policy decision making, (think about other policies and portals in other ministries) (if you get buy in and it can move it forward) workshops, [bridging to osm – Satya] – advocating with various public officials – important thing to do.
  3.  DataMeet has members with excellent data skills – students what to learn data tools – people interested in teaching and students learning more about data skills – help people use and learn data tools- help students – basic and small workshops – Ravi
    1. when working with students – causes more due diligence – do it with an outside audience  –
    2. hold them in north and south campus – in a college.
    3. focused result workshops with journalists – focused with practical ends – training
    4. Student Workshops – Ravi, Krishnan, Nisha, Guneet,  will work together to plan a few for March, April
  4. open community, talks, organization, regular talks, conference
  5.  act like a platform – teach learn and doing
  6. talks, half day and 1 day hacks, areas to work, data entreauapneirship, public policy (budget state and local) – WASH, tie up with startups  – startups and private sector come in and talk about their issues and using data – start up tie in does help with advocacy – lobbying/legal political advisories – open source data conversation
    1. let’s think about specific audiences, there are so many catalogues – list of all the catalogues of different sources and mash up data
    2. use gov data, collect public data and speak with them about publishing data, data tools service
  7. team up with non for profits and help them solve their problems – break thru -woman’s group – support them  – ashoka, idrc, go thru them and see who needs help  – later in the year – happy to solve them – take them up as they challenging etc
    1. Non Profits –  submit problems and we can take them up as they come up and make that a focus on the DataMeet
    2. helping NGOS – on board with what they want to achieve – figure out the larger things
  8.  data problems – data successes – inspire and learn and connect
  9. work more with start ups – spread open data ideas
    1. side meetings – working with gov, ngo’s and startups – sumandro, raman,
  10. work with lamp fellows, prime minister rural fellows
    1. Government  – we should be willing to help the government as well – government isn’t easy to work with and is time intensive

TEACHING, LEARNING, DOING – The above purpose and values can be categorized under this mantra.

  • teaching students
  • doing advocacy and ngo solves problems
  • compiling casestudies
  • give rewards – push it to happen
  • make sure datameet gets credited
  • open data success stories

CALENDAR 

Feb –

    • Gurgoan budget data – Namrehta – interested in knowing more about what is happening – ongoing – state prs people – ADR – state chapter – city budget – ties into the overall state budget – income into city from state – and vice versa – long campaign – filing a PIL – ongoing – do a non profit – learning training thing
    • Assembly election in FEb

March

  • budget data ramanjit cheema,- bring groups who work on budget together – AI, CBGA
  • out in the open themed pecha kucha

June

  • capacity building with civil society groups
  • session of learning and- need to dismystify the tech heavy agenda of the group

July

  • AKVO event – water sanitation – manifesto what are the data gaps – bring them together – talk about data and shareing and advocacy – formats – INdia Wash Forum

 Oct

  • Public transport data – Guneet, Namrehta,

 Dec

  • Malnutrition

 Nov

  • Open Data Camp

 New Organizers of Delhi Data Meet!!!

Guneet, Isha, and Prachi!!!

Thanks to everyone for a great meeting! If I missed anything please add to the comments!


Open Transit Data for India

(Suvajit is a member of DataMeet’s Transportation working group, along with Srinivas Kodali, we are working on how to make more transit related data available.)

Mobility is one of the fundamental needs of humanity. And mobility with a shared mode of transport is undoubtedly the best from all quarters – socially, economically & environmentally. The key to effective shared mode of transport (termed as Public Transport) is “Information”. In India cities, lack of information has been cited as the primary reason for deterrence of Public Transport.

Transport Agencies are commissioning Intelligent Transport Systems (ITS) in various mode and capacity to make their system better and to meet the new transport challenges. Vehicle Tracking System, Electronic Ticketing Machines, Planning & Scheduling software are all engines of data creation. On the other side, advent of smart mobile devices in everyone’s hand is bringing in new opportunities to make people much more information reliant.

But the demand for transit data is remarkably low. The transit user and even transit data users like City Planners should demand for it.
The demand for Public Transport data in India should be for the following aspects:

A. Availability
To make operation and infrastructure data of Transport operators easily available as information to passengers in well defined order to plan their trip using available modes of Public Transport.

B. Interoperability
To make transit data provided by multiple agencies for different modes (bus, metro, rail) usable and make multi modal trip planning possible.

C. Usability
To publish transit oriented data in standard exchange format across agencies in regular frequencies to provide comprehensive, accurate and updated data for study, research, analysis, planning and system development.

D. Standardisation
To be a part of Passenger charter of Transport Operators to publish their data in standard format and frequency. This can also serve as a guideline for Transporter Operator while commissioning any system like Vehicle Tracking System, ITS, Passenger Information System, website etc.

What kind of Transit data is needed ?

  • Service Planning data

It will comprise of data on bus stops, stations, routes, geographic alignment, timetables, fare charts. With this dataset, general information on transit service can be easily gathered to plan a journey. Trip Planning mobile apps, portals etc can consume this data to provide ready and usable information for commuters.

  • Real time data

A commuter is driven by lot of anxieties when they depend on public transport mode. Some common queries; “When will the bus arrive ?”, “Where is my bus now?”, “Will I get a seat in the bus ?”, “Hope the bus has not deviated and not taking my bus stop.”.

Answer to all this queries can be attended via real time data like Estimated Time of Arrival (ETA), Position of the vehicle, Occupancy level , Alert and Diversion messages etc. Transport Operator equipped with Tracking systems should be able to provide these data.

  • Operational & Statistical Data

A Transport Operators operational data comprises of ticket sales, data of operation infrastructure and resources like Depots, Buses, Crew, Workshops etc. As operatore are tending towards digital mode of managing these data it also makes a good option to publish them at regular intervals.

A general commuter might not be interested in this data, but it will very useful for City Planners to analyse the trend of commute in the city and make informed decision. City transport infrastructure can be planned to orient it towards transit needs and demands.

The transport agency can benefit highly by demonstrating accountability and transparency. They can uplift their image as a committed service provider thereby gaining for passengers for their service.

So, together it will make a thriving landscape, if the data creators of Public Transport in India provide their data in Open which can be consumed by a larger set of people to build platforms, applications, solutions for transport study, analysis & planning across different section of users.

Open Transit Data is the tipping point for Smart Mobility in India.

That is why we have started putting our thoughts together and began writing an Open Transport Data Mainfesto.

GeoBLR in 2015 – Mapping Unmapped Places!

Dholera, Ahmedabad

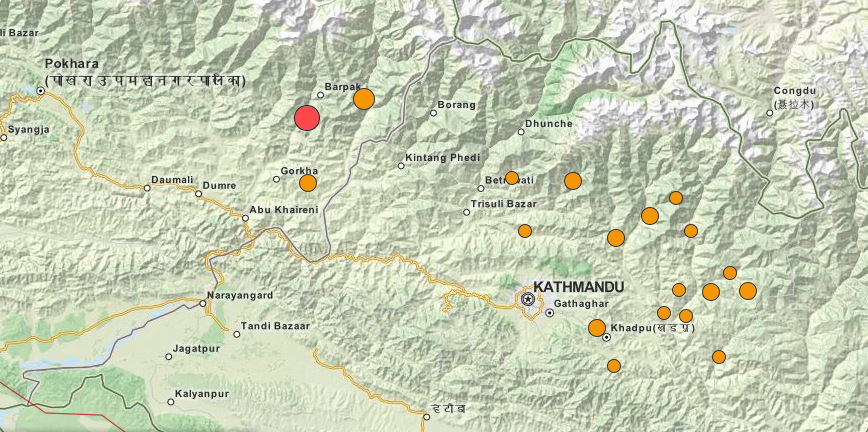
To kick things off in 2015, we met at the offices of the Centre for Internet and Society (CIS), Bengaluru to map the unmapped/less-mapped settlements along the proposed Delhi-Mumbai Infrastructure Corridor (DMIC) project. The DMIC, a 1,483 km-long development corridor spanning several states in northern and western India, has been attracting a lot of curiosity and criticism from the national and international participants and observers. The project will have built a dedicated freight corridor, several industrial and logistics hubs, and smart cities at its completion. The project has been structured to be constructed in phases. The pilot project for an integrated smart city, Dholera Special Investment Region (SIR), is underway.

B61DDQzCUAACknX

The quality of mapping in many regions relies on a very active mapping community, or a strong interest from a collectives and local networks. We think it is important regardless to map the assets that pre-exist around the proposed sites of developments. With this in mind, we decided to take a look at the areas earmarked for the Dholera SIR (Gujarat), Shendra (Maharashtra), Mhow (Madhya Pradesh), and Dadri/ Greater Noida (NCR). The evening began with Tejas introducing the DMIC project, the scale of new development, and the need to capture these changes for years to come on OpenStreetMap (OSM). Sajjad provided a rapid tutorial on signing up for OSM, and using the browser-based map editor. The party was attended by guests at CIS as well as remotely from Bangalore and Dharamsala.

B61Hg57CIAAmBmV.jpg_large

As the party progressed, several guests ended up mapping roads, buildings, and water bodies in the Dholera region. Others chose to similarly map Shendra, and Dadri.

Data Expedition: Do Din Edition

Do Din is an Hyderabad City Event focused on looking at how Hyderabad is progressing and changing. The organizers Hyderabad Urban Labs and Right to the City have this event every year to create a space to allow people to exchange ideas, understand problems, and share solutions for different aspects of urban life.

As part of my fellowship with School of Data I thought, Do Din would be a great place for us to have our joint data event. We worked with Do Din to make Hyderabad related datasets available and people familiar with those datasets, while DataMeet and School of Data runs the event and provide experts in mapping and design.

We had almost 30 participants throughout the day, from various backgrounds. We explore what data was and the issues around getting it and using it.

Then we looked at the data we had available. We focused on 3 data sets.

  1. Bus Transport data – routes, stops, types of buses, and income of buses.
  2. Slum data – location of slum
  3. Complaints registered regarding lakes in the city.

These were the cleanest and most accessible datasets.

After going through the data and working out the confusing unclear parameteres we split into groups to start working on datasets.

5 groups were there and each worked on a data set.

  1. Group one worked on slum data
  2. Group two worked on the lake data
  3. Group three also worked on the lake data
  4. Group four worked on the slum data
  5. Group five worked on the bus data.

Each group had a mix of technical, design, analytical, coder skills. So we were excited to see the various outputs.

After working through the data each group presented their outputs.

Group One

Produced a basic map of slums and population

Group Two

They had mapped the lakes and then did analysis based on what complaints were registered to each lake.

Group Three

Used Carto DB to make a map of the lakes

Group Four

Made a map of the slums.

Group Five

Did analysis on which types of bus made the most money over the course of their trips.

Learnings

While the outputs were great it was a fantastic exercise in working with datasets and different types of people. Probably one of the best data related events we have hosted.

DataMeet is a community of Data Science and Open Data enthusiasts.