Tag Archives: india

Know Your MP: Probing Election Affidavits with Maps

Project by Shailendra Paliwal and Kashmir Sihag
Note: This blog post was written by Shailendra

I want to share a 3 year old project I and my friend Kashmir Sihag Chaudhary did for Jaipur Hackathon in a span of 24 hours. It is called Know Your MP, it visualizes data that we know about our members of parliament on a map of Indian Parliamentary Constituencies.

A friend and a fellow redditor Shrimant Jaruhar had already made something very similar in 2014 but it was barely usable since it took forever to load and mostly crashed my browser. My attempt with Know Your MP was to advance on the same idea.

The Dataset

Election Commission of India requires that every person contesting the elections fill an affidavit and therby disclosing criminal, financial and educatinal background of each candidate. There have been a few concerns about this, a major one being that one could as well enter misleading information without any consequences. If you would remember the brouhaha over education qualifications of Prime Minister Modi and the cabinet minister Smriti Irani, it started with what they entered in their election affidavits. However, it is widely believed that a vast majority of the data colllected is true or close to true which makes this a dataset worthy of exploration.

However, like a lot of data from governments, every page from these affidavits are made available as individual images behind a network of hyperlinks on the website of Election Commission of India. Thankfully, all of this data is available as CSV or Excel Spreadsheets from [MyNeta.info](http://myneta.info/). The organization behind MyNeta is Association of Democratic Reforms(ADR) which was established by a group of professors from Indian Institute of Management (Ahmedabad). ADR also played a pivotal role in the Supreme Court ruling that brought this election disclosure to fruition.
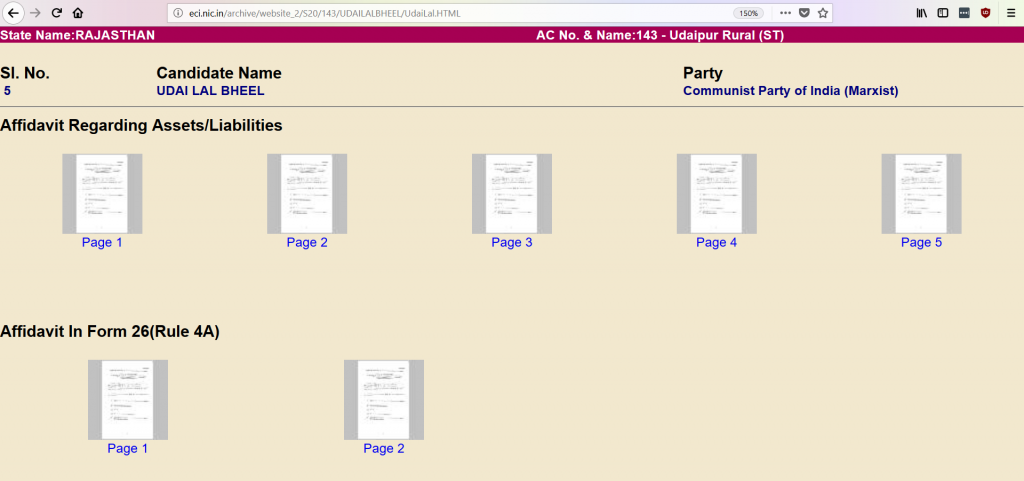
everything is neatly laid out


Cadidate Affidavit of CPI(M) candidate Udai Lal Bheel from Udaipur Rural constituency in Rajasthan. link

Preparing the Map

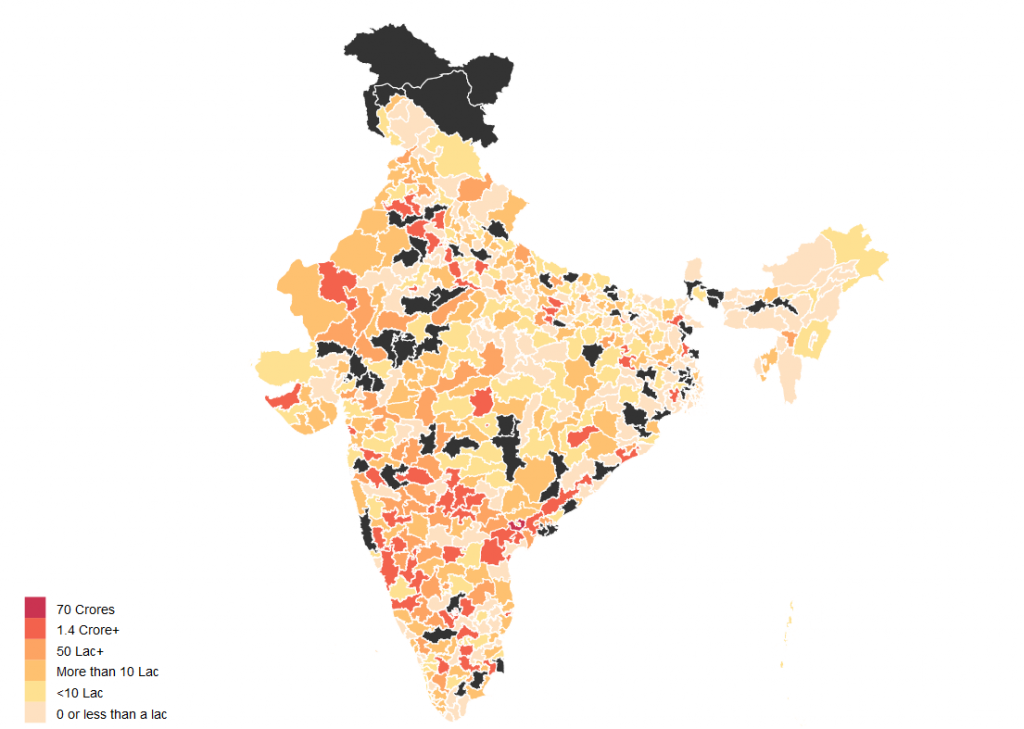
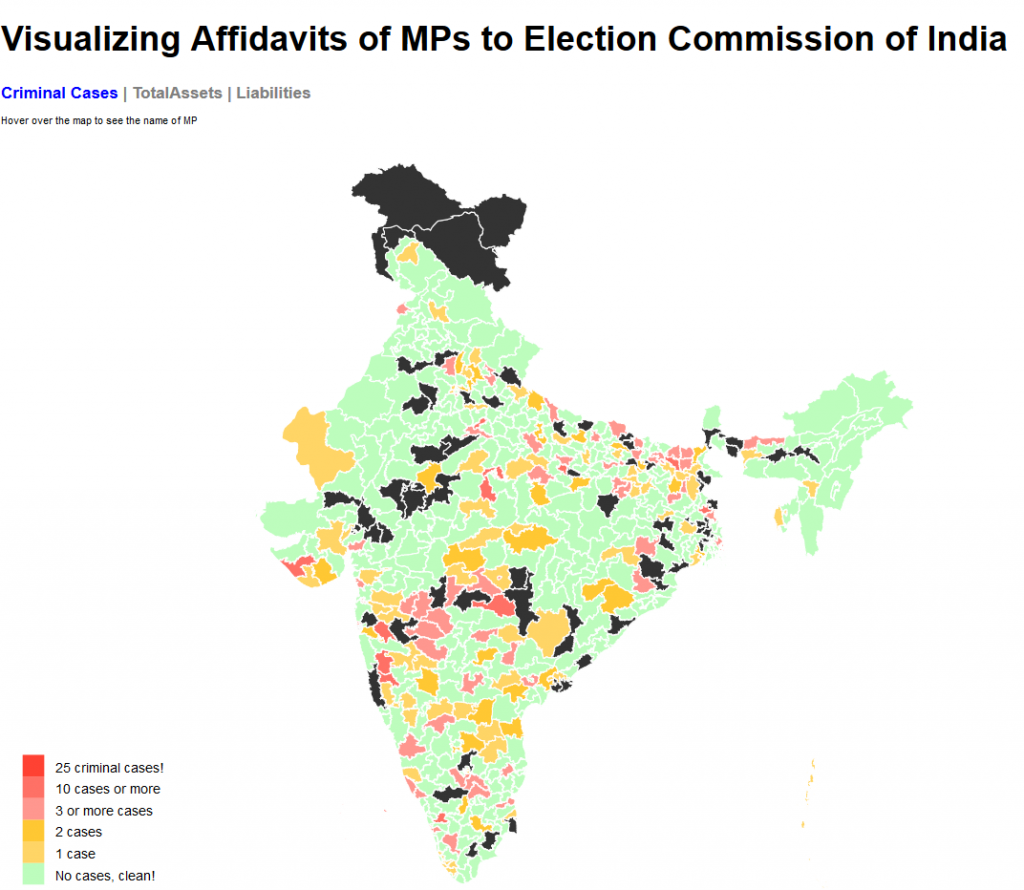
This data needs to be visualized on a map with boundaries showing every parliamentary contituency. Each constituency will indicate the number of criminal cases or assets of their respective MP using a difference in shading or color. Such visualizations are called choropleth maps. To my surprise, I couldn not find a map of Indian parliamentary constituencies from any direct or indirect government sources. That is when datameet came to my rescue. I found that DataMeet Bangalore had released such a shapefile. It is a 13.7MB file(.shp). Certainly not usable for a web project.

Next task would be somehow compress this shapefile to a small enough size that can be then used either as a standalone map or as an overlay on leaflet.js or Google Maps (or as I later learned Mapbox too).

From the beginning I was looking at d3.js to achieve this. The usual process to follow would be to convert the shapefile (.shp) into JSON format which D3 can use.

For map compression I found that Mike Bostock (a dataviz genius and also the person behind D3) has worked on a map format that does such compression, the format is called GeoJSON. After a bit of struggling with making things work on a Windows workstation and tweaking around with the default settings, I managed to bring the size down to 935 KB. Map was now ready for the web and I now had to only wade through D3 documentation to make the visualization.

Linking data with map and Visualization

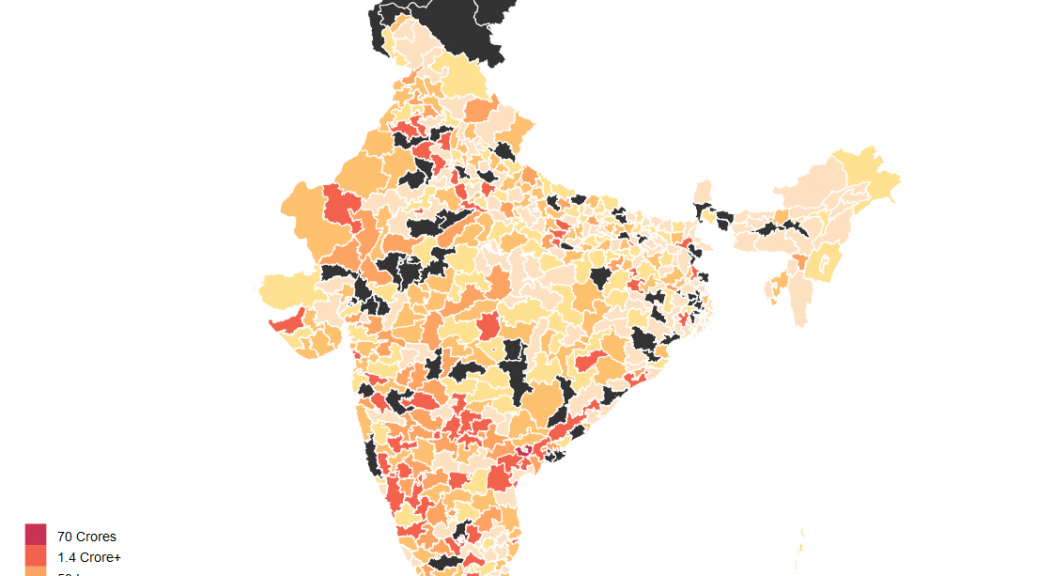
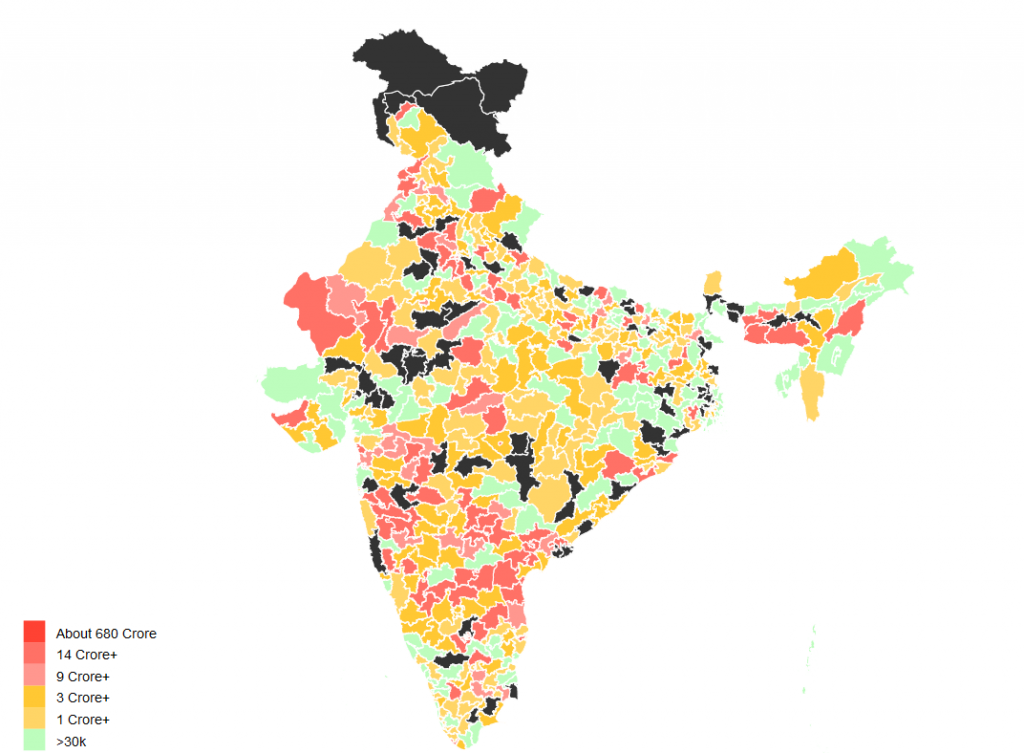
Each parliamentary region in the GeoJSON file has a name tag which links it to the corresponding data values from dataset. A D3 script on the HTML page parses both and does this job to finally render this choropleth map.

The black regions on the maps are parliamentary contituencies that have alternate spellings. I could have used levenshtein distance to match them or more simply linked the map to data with a numeric ID. I’ll hopefully get that done someday soon.

link to project, github, map

Finally Looking at Data

The average member of parliment (only a few MPs have changed since 2015) has at least 1 criminal case against them, has a total asset value of about 14 Crore INR and has liabilities of value 1.4 Crore INR. But this dataset also has a lot of outliers so mean isn’t really the best representative of the central tendency. The median member of parliament has 0 criminal case against them, has total assets worth 3.2 Crore INR and has liabilities of value 11 Lakh INR.

The poorest member of parliament is Sumedha Nand Saraswati from Sikar who has total assets worth 34 thousand INR. Richest MP on the other hand is Jayadev Galla with declared assets of 683 Crore INR. Galla doesn’t directly fit the stereotypical corrupt politician meme with zero criminal cases against him. His wealth is best explained to the success of lead acid battery brand Amaron owned by the conglomerate his father founded in 1985.
Open Access Week 2015 India Events

It’s Open Access Week! This week there are events around the country to celebrate openness and explore how far we have to go.

MapBox is putting up an amazing Open Data Gallery Tuesday the 20th in Bangalore. Come and hangout look at incredible art and projects from around the country!

In celebration DataMeet is doing its first MULTI CITY EVENT!

Join us Saturday 24th at 6:30pm for talks from Data.Gov.In, Ahmedabad and Bangalore with livestreaming between the cities!

  • Data.Gov.In will talk about the latest updates to Open Data in India.
  • Bangalore will discuss open access in general and open data projects.
  • Ahmedabad will talk about the status of Open Access in their part of the world.
  • Srinivas Kodali will talk about releasing datasets.

Bangalore’s event will be at Centre for Internet and Society.

Ahmedabad will be at CEPT University. 

Please RSVP on Facebook or Meetup.

Let’s celebrate all we have been able to accomplish as a community and look forward to continuing to promote a culture of openness, sharing, learning and collaboration.


Latlong’s story of mapping India

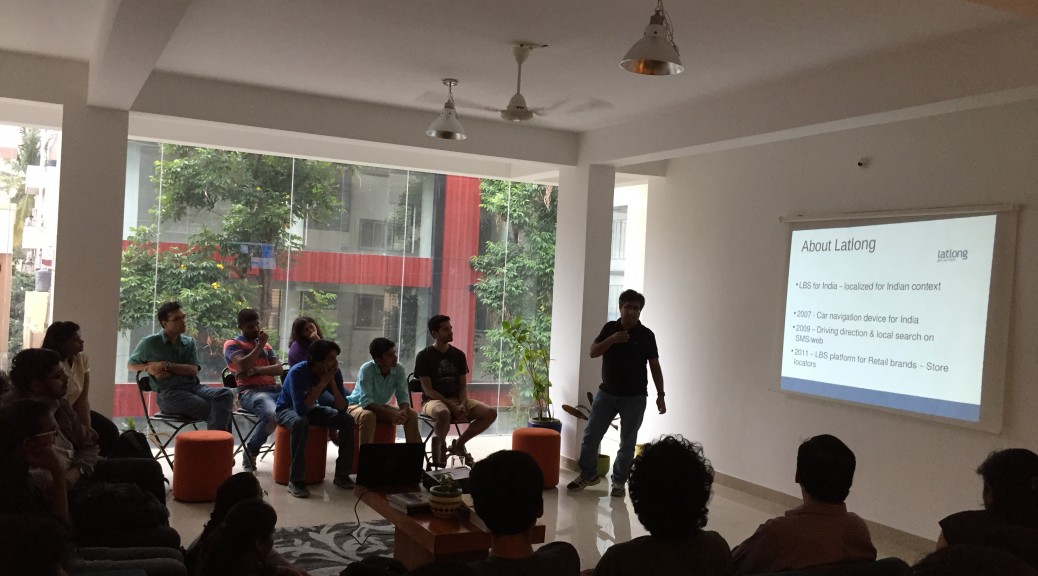
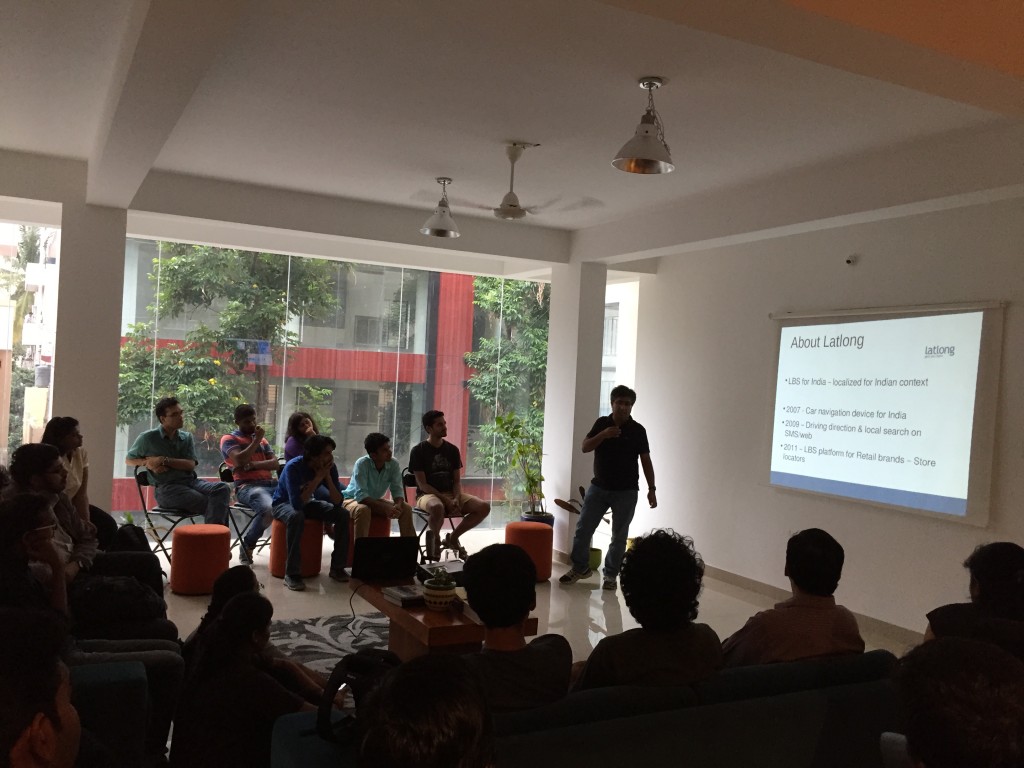
The July edition of GeoBLR featured Rahul RS from Onze Technologies. Onze is the prefered store locator infrastructure by several businesses in India including TVS, Dell and Cafe Coffee Day. The store locator is powered by Onze’s very own Latlong.in – extensive, web based points of interest and map data interface.

2015-07-30 18.23.40

Rahul shared the story of Latlong.in, their infrastructure and challenges mapping Indian cities. They started out in 2007 at a time when there was no reasonable geographic data source available for India – commercial and non-commercial. Rahul’s team gathered toposheets from the Survey of India and georeferenced boundaries to incorporate into their maps. Rahul pointed out that these are inexpensive but high effort tasks. Plus, tools to do these are expensive.

In order to address India-specific mapping needs, geo-rectification needed to be inevitably supported by field surveys. Each city is unique and people entirely depend on landmarks and hyperlocal information to get around. Rahul brought in experts from different areas to gather local information. “The idea behind Latlong.in starts by saying that addresses don’t work in India”, says Rahul. When OpenStreetMap picked up, Latlong.in moved to a mix of their data and OSM that was maintained on their own. It is a complicated effort. Conflation and dealing with multiple revisions of data is tricky and there aren’t great tools to deal with it effortlessly. Latlong.in follows Survey of India’s National Map Policy. They avoid mapping defence and high security features.

Owning the entire data experience is critical to win in this market. Remaining open and improving continuously is the only way to keep your datasets upto date.

Open Transit Data for India

(Suvajit is a member of DataMeet’s Transportation working group, along with Srinivas Kodali, we are working on how to make more transit related data available.)

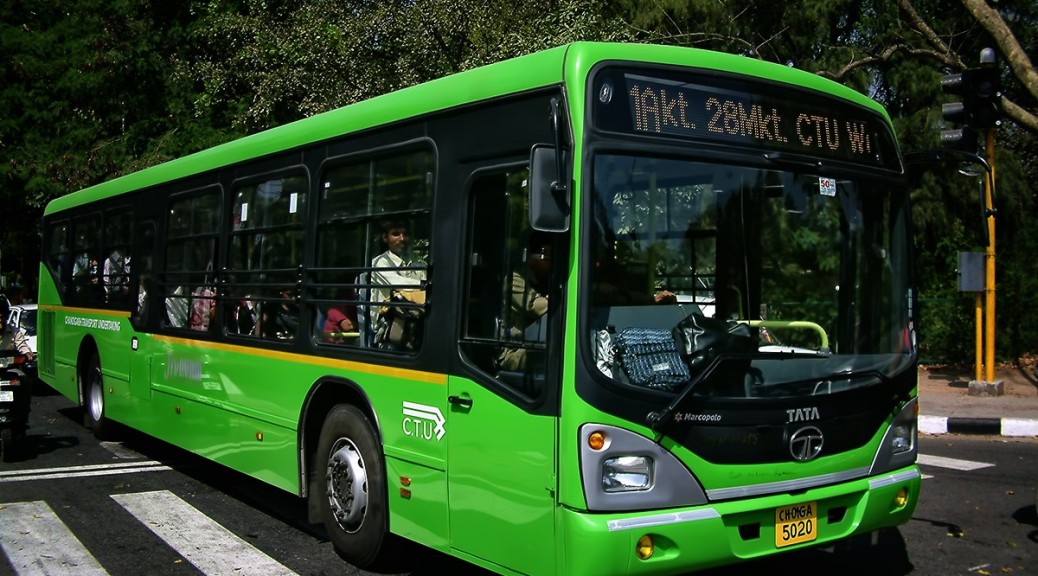
Mobility is one of the fundamental needs of humanity. And mobility with a shared mode of transport is undoubtedly the best from all quarters – socially, economically & environmentally. The key to effective shared mode of transport (termed as Public Transport) is “Information”. In India cities, lack of information has been cited as the primary reason for deterrence of Public Transport.

Transport Agencies are commissioning Intelligent Transport Systems (ITS) in various mode and capacity to make their system better and to meet the new transport challenges. Vehicle Tracking System, Electronic Ticketing Machines, Planning & Scheduling software are all engines of data creation. On the other side, advent of smart mobile devices in everyone’s hand is bringing in new opportunities to make people much more information reliant.

But the demand for transit data is remarkably low. The transit user and even transit data users like City Planners should demand for it.
The demand for Public Transport data in India should be for the following aspects:

A. Availability
To make operation and infrastructure data of Transport operators easily available as information to passengers in well defined order to plan their trip using available modes of Public Transport.

B. Interoperability
To make transit data provided by multiple agencies for different modes (bus, metro, rail) usable and make multi modal trip planning possible.

C. Usability
To publish transit oriented data in standard exchange format across agencies in regular frequencies to provide comprehensive, accurate and updated data for study, research, analysis, planning and system development.

D. Standardisation
To be a part of Passenger charter of Transport Operators to publish their data in standard format and frequency. This can also serve as a guideline for Transporter Operator while commissioning any system like Vehicle Tracking System, ITS, Passenger Information System, website etc.

What kind of Transit data is needed ?

  • Service Planning data

It will comprise of data on bus stops, stations, routes, geographic alignment, timetables, fare charts. With this dataset, general information on transit service can be easily gathered to plan a journey. Trip Planning mobile apps, portals etc can consume this data to provide ready and usable information for commuters.

  • Real time data

A commuter is driven by lot of anxieties when they depend on public transport mode. Some common queries; “When will the bus arrive ?”, “Where is my bus now?”, “Will I get a seat in the bus ?”, “Hope the bus has not deviated and not taking my bus stop.”.

Answer to all this queries can be attended via real time data like Estimated Time of Arrival (ETA), Position of the vehicle, Occupancy level , Alert and Diversion messages etc. Transport Operator equipped with Tracking systems should be able to provide these data.

  • Operational & Statistical Data

A Transport Operators operational data comprises of ticket sales, data of operation infrastructure and resources like Depots, Buses, Crew, Workshops etc. As operatore are tending towards digital mode of managing these data it also makes a good option to publish them at regular intervals.

A general commuter might not be interested in this data, but it will very useful for City Planners to analyse the trend of commute in the city and make informed decision. City transport infrastructure can be planned to orient it towards transit needs and demands.

The transport agency can benefit highly by demonstrating accountability and transparency. They can uplift their image as a committed service provider thereby gaining for passengers for their service.

So, together it will make a thriving landscape, if the data creators of Public Transport in India provide their data in Open which can be consumed by a larger set of people to build platforms, applications, solutions for transport study, analysis & planning across different section of users.

Open Transit Data is the tipping point for Smart Mobility in India.

That is why we have started putting our thoughts together and began writing an Open Transport Data Mainfesto.

GeoBLR – PIN Code Extravaganza!

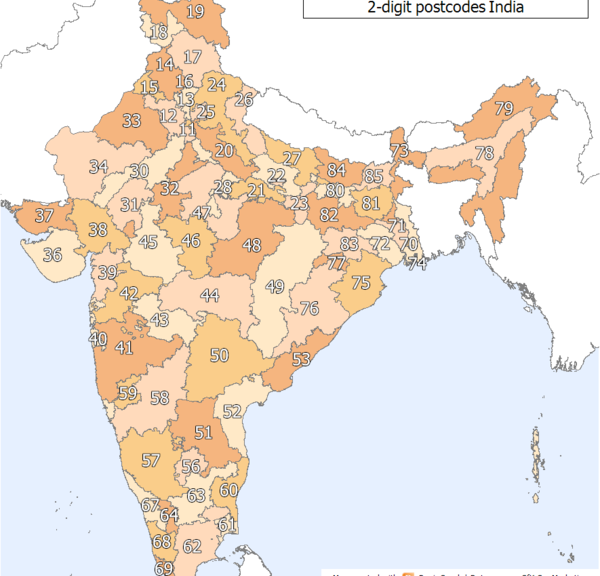
Last week at GeoBLR we discussed the issues around PIN codes. The most  important questions were around the processes the postal system and also what are the issues around the availability of reliable spatial data.

Couple of weeks back, Nisha and I started putting together several questions that we would like to get insights on. We used that as the starting point for the discussions. The meat of the problem really is that nobody knows what the processes are and how to get that information.

Prior to GeoBLR, we met some people who are interested in the same issue and clarified a lot of things – for instance, we are now sure that some times a single post office can deal with more than one PIN code.

To get a sense how people felt about the PIN codes issues, we asked around. Some people don’t bother to use PIN codes for any substantial service other than sending post cards.  As long as we are not able to tie PIN codes to geographic locations reliably, it’s not so useful.  Everybody agrees that it has immense potential just because it’s the only part of the address that everybody gets right (most of the time).

We also started to brainstorm how to come up with a plan so that a group like ours along with several other partners could work together to attempt to crowdsource the issue. Read more about the plan and next steps here!

20140821_191027 20140821_191035