Tag Archives: data

Data Diaries: What I learned

As some of you might know I’ve recently moved back to the US and after taking a break, I wanted to share some of my thoughts on the past 7 years of Open Data in India. These are just some of the big lessons I’ve learned and observations that I think are important.

Data needs advocates from every sector

Historically the biggest voices that government hears about data are corporations selling products or statisticians being gatekeepers. Now that data is a part of everybody’s life in ways that are unseen, data literacy is necessary for everyone and data needs advocates from every walk of life. What I experienced with DataMeet was that broad data ideas with inputs from experts from all sectors can be very powerful. When you advocate for the data itself and how it needs to be accessible for everyone you can give solutions and perspectives that statisticians and for profit companies can’t. Ideas that are new because they are in the best interest of the whole.  That’s why we are invited to the table because even though it doesn’t make political or economic sense (yet) to listen to us, it is a different perspective that is helpful to know.

This is why every sector, education, environment, journalists, all actors have to integrate a data advocacy component to their work.  Issues of collection, management, and access affect your work and when you go to talk to governments about the issues you want to improve, creating better data and making it easier to get should automatically be apart of it. The idea of “I got the data I need so I’m good” does not make the next time you need data, or being upset with the quality of data  being used to create policy, easier to deal with.

Building ecosystems are more important than projects

In 2011 when I started to work on water data, it became clear that there was no techie/data ecosystem for non profits to tap into for advice and talent. There were individuals but no larger culture of tech/data for public good. This hadn’t been the case in the US so when I was at India Water Portal I wanted to spend time to find it because it’s really important for success. I was basically told by several people that it wasn’t possible in India. That people don’t really volunteer or share in the way the west does. It will be difficult to achieve.

With open data growing quickly into an international fad with lots of funding from places like Open Gov Partnership and Omidyar, I knew open data projects were going to happen. But they would be in silos and they would largely not be successful. Creating a culture that asks and demands for data and then has the means to use it is not something that is created from funded projects. It comes from connecting people who have the  same issues and demonstrating the demand.

DataMeet’s largely been a successful community but not a great organization. This is my fault. A lot of my decisions were guided by those early issues. It was important to have a group of people demonstrating demand, need, and solutions who weren’t paid to be advocates but who were interested in the problem and found a safe space to try to work on it. That is how you change culture, that is why I meed people who say I believe in open data because of DataMeet. That would not have happened as much if we just did projects.

You can’t fundamentally improve governance by having access to data.

It is what we work toward as a movement but it just doesn’t really work that way- because bad governance is not caused by the lack of information or utilization of data. Accountability can’t happen without information or data; and good governance can’t happen without accountability. But all the work spent on getting the government to collect and better use data is often not useful. Mostly because of the lack of understanding of what is the root cause of the issue. I found that budget problems, under staffing, over stressed fire fighting, corruption, interest groups, and just plain apathy are more to blame then really the lack of information. This is something that civil society has to relearn all the time. Not to say data can’t help with these things, but if your plan is to give the government data and think it will solve a problem you are wasting time. Instead you should be using that data to create accountability structures that the government has to answer to. Or use that data to support already utilized accountability influences.

You gotta collect data

Funding that doesn’t include data collection, cleaning, processing costs is pointless. Data collection is expensive but necessary. In a context like India’s where it is clear that the government will not reach data collection levels that are necessary, you have to look at data collection as a required investment.  India’s large established civil society and social sector is one of its strongest assets and they collect tons of data but not consistently. A lot of projects I encountered were based on the western models of the data being there, even if not accessible, it is complete somewhere. NOPE. They count on the data existing and don’t bother to think about the problem of collection, clean up, processing, and distribution. You have to collect data and do it consistently it has to become integrated in your mission.

Data is a pretty good indicator of how big a gap exists between two people trying to communicate.

100% of every data related conversation goes like this “The data says this but I know from experience that…. ” Two people will have different values and communicating a value by saying “I think you should track xyz also, because its an important part of the story” can be a very productive way to work out differences. That is why open data methodology is so important. It also becomes a strong way for diverse interests to communicate and that is always a good thing.

Data is a common

In places that still don’t have the best infrastructure. Where institutions and official channels aren’t the most consistent. The best thing you can do is make information open and free. It will force issues out, create bigger incentives for solutions, and those solutions will be cheaper. Openness can be a substitute for money if there is an ecosystem to support the work.

You can collect lots of data but keeping it gets society no where.

A lot of people in India are wasting a lot of time doing the same thing over and over again. If I had 5 rupees for every person I spoke to who said they had already processed a shapefile that we just did, or had worked with some other dataset that is hard to clean up I could buy the Taj Mahal. Data issues in the country are decades old, but not sharing it causes stunting. Momentum is created from rapid information sharing and solutions; proprietary systems and data hoarding doesn’t. The common societal platforms that are making their way around India’s civil society and private company meeting rooms won’t do it either. You can’t design a locked in platform with every use in mind, its why generally non open portals have had such limited success. If you have solved a hard problem and make it open you save future generations from having to literally recreate the wheel you just made. How much more brainpower can you dedicate to the same problems? Let people be productive on new problems that haven’t been solved yet.

The data people in government are unsung heroes.

Whenever I met an actual worker at the NIC or BHUVAN or any of the data/tech departments they were very smart, very aware of the problems, and generally excited about the idea of DataMeet and that we could potentially help them solve a problem. It was not uncommon when being in a meeting with people from a government tech project for them to ask me to lobby another ministry to improve the data they have to process. While I wish I had that kind of influence it made me appreciate that the government is filled with people trying their best with the restrictions they have, but the government has “good bones” as they say and with better accountability could get to a better place.

I don’t think I covered everything but I’m very grateful for my time working on these issues in India. I feel like I was able to achieve something even though there is so much more to do. To meet all the people who are dedicated to solving hard problems with others and never giving up will inspire me for a long time.



Open Access Week – Open a Dataset with Srinivas Kodali

Cross post from Lost Programmer

Starting today it is International Open Access Week, I have been associated with concepts of open data and open access since 2012 and was hoping to bring some serious attention to it in India. This week I intend to showcase a serious of datasets which several departments of Govt. of India publishes in there web portals through NDSAP apart from Open Government Data Platform

Today’s dataset which I want to bring attention is of Indian Customs. Indian customs maintains records of every product imported and exported through land, sea and air. They publish this data through their commerce portal. They should be highly appreciated for maintaining this website and publishing the data. The data is published as per Notification No. 18/2012-Customs (N.T) dated: 5th Mar, 2012

The data being published includes origin, destination ports, name of the product, Harmonized System code of the product, quantity of product, unit quantity of the product, customs valuation of the product. For imported goods, the origin country is published instead of the port, while for export you get to know the exact destination city.

Read the rest over at Srinivas’s blog here

And if you are using the data for anything please let us know! Stay tuned for tomorrow’s release!

Olacabs at GeoBLR

Last week, we gathered at the Paradigm Shift cafe in Koramangala, to learn about the location data infrastructure at Olacabs.com. The meetup was particularly interesting in the light of Ola’s recent move adding autorickshaws to their offering. Location is at the center of Ola’s business.

Vijayaraghavan Amirisetty, Director of Engineering at Olacabs, introduced how they collect data in real-time from cars fitted with smartphones. With over a lakh vehicles online at any given time, Ola’s primary challenge is to build an infrastructure to allocate taxis to customers quickly and reliably. Vijay highlighted some of the issues around collecting location data via GPS and cell networks. Even though both the technologies have matured since their inception, they are highly unreliable in various scenarios. Ola uses a combination of algorithms to build a reliable layer over GPS and network. One thing to note is that the smartphones are of variable quality and the system needs to work regardless of these metrics.

olameetup

Even though Ola is using Google Play services as their location aggregator, in India, network is a bigger challenge. Quality varies from city to city and also reception within a city in unpredictable. Ola falls back to SMS, driver’s phone and a set of offline algorithms if the network is unavailable. Ola’s infrastructure is built using technologies like MongoDB, MySQL, Cassandra, Redis and Elastic Search. They are also exploring integrating web sockets and an experimental custom Android mod.

There was a lot of feedback from the audience specifically around why it is difficult for the drivers to locate the customer. Driver training is not an easy task – there are a lot of logistical and operational challenges. Vijay emphasised on the amount of work Ola does to improve the drivers’ experience with the whole process of on-boarding their cars.

Everything at Ola is realtime – why would anyone book an auto through Ola if they can just walk out and get one in less than a minute. They are continuing to improve and innovate to revolutionize transportation in Indian cities.

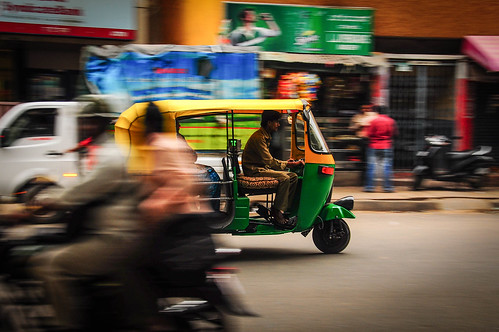
Autorickshaw photo CC 2.0 Spiros Vathis

GeoBLR in 2015 – Mapping Unmapped Places!

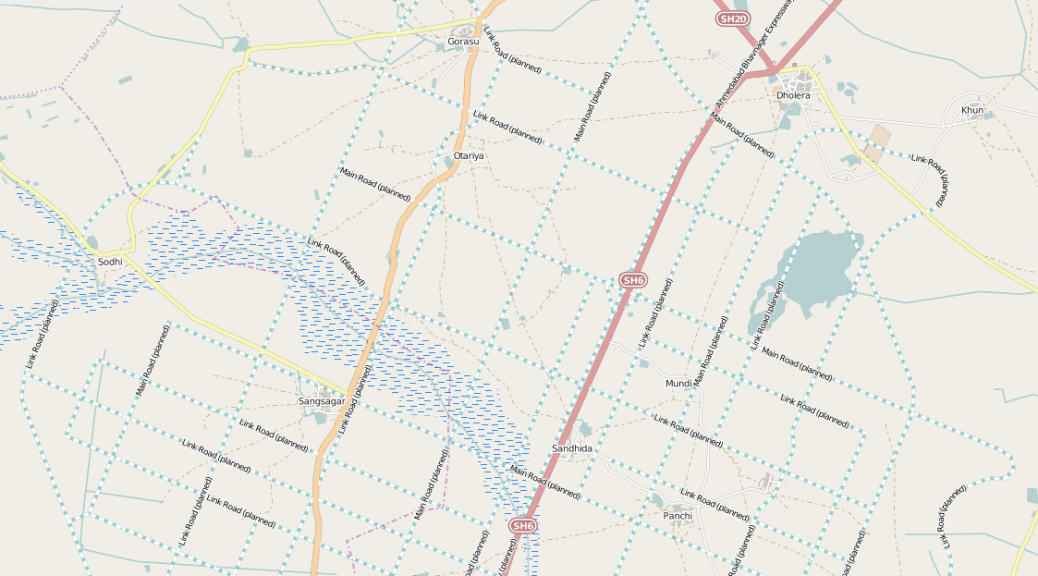
Dholera, Ahmedabad

To kick things off in 2015, we met at the offices of the Centre for Internet and Society (CIS), Bengaluru to map the unmapped/less-mapped settlements along the proposed Delhi-Mumbai Infrastructure Corridor (DMIC) project. The DMIC, a 1,483 km-long development corridor spanning several states in northern and western India, has been attracting a lot of curiosity and criticism from the national and international participants and observers. The project will have built a dedicated freight corridor, several industrial and logistics hubs, and smart cities at its completion. The project has been structured to be constructed in phases. The pilot project for an integrated smart city, Dholera Special Investment Region (SIR), is underway.

B61DDQzCUAACknX

The quality of mapping in many regions relies on a very active mapping community, or a strong interest from a collectives and local networks. We think it is important regardless to map the assets that pre-exist around the proposed sites of developments. With this in mind, we decided to take a look at the areas earmarked for the Dholera SIR (Gujarat), Shendra (Maharashtra), Mhow (Madhya Pradesh), and Dadri/ Greater Noida (NCR). The evening began with Tejas introducing the DMIC project, the scale of new development, and the need to capture these changes for years to come on OpenStreetMap (OSM). Sajjad provided a rapid tutorial on signing up for OSM, and using the browser-based map editor. The party was attended by guests at CIS as well as remotely from Bangalore and Dharamsala.

B61Hg57CIAAmBmV.jpg_large

As the party progressed, several guests ended up mapping roads, buildings, and water bodies in the Dholera region. Others chose to similarly map Shendra, and Dadri.

Rebuilding the Karnataka Learning Partnership Platform

The Karnataka Learning Partnership recently launched a new version of their platform. This post talks about why they are building this and also some of the features and details. This is cross-posted from their blog.

Over the past five months we have been busy rearchitecting our infrastructure at Karnataka Learning Partnership. Today, we are launching the beta version of the website and the API that powers most of it. There are still a few rough edges and incomplete features, but we think it is important to release early and get your feedback. We wanted to write this blog post along with the release to give you an overview of what has changed and some of the details of why we think this is a better way of doing it.

Data

We have a semi-federated database architecture. There is data from Akshara, Akshaya Patra, DISE and other partners; geographic data, aggregations and meta-data to help make sense of a lot of this. From our experience PostgreSQL is perhaps the most versatile open-source database management system out there, Especially when we have large amounts of geographic data. As part of this rewrite, we upgraded to PostgreSQL 9.3, which means better performance and new features.

Writing a web application which reads from multiple databases can be a difficult task. The trick is make sure that there is the right amount of cohesiveness. We are using Materialized Views in PostgreSQL. Materialized View is a database object that stores the result of a query in a on-disk table structure. They can be indexed separately and offer higher performance and flexibility compared to ordinary database views. We bring the data in multiple databases together using Materialized Views and refreshing them periodically.

We have a few new datasets – MP/MLA geographic boundaries, PIN code boundaries and aggregations of various parameters for schools.

API

The majority of efforts during the rewrite went into making the API, user interface and experience. We started by writing down some background. The exhaustive list of things that the API can do are here.

We have a fairly strong Python background and it has proven to be sustainable at many levels. Considering the skill-sets of our team and our preference for readable, maintainable code, Django was an obvious choice as our back-end framework. Django is a popular web development framework for Python.

Since we were building a fairly extensive API including user authentication, etc., we quickly realized that it would be useful to use one of the many API frameworks built on top of Django. After some experimentation with a few different frameworks, we settled on using Django-Rest-Framework. Our aim was to build on a clean, RESTful API design, and the paradigms offered by Rest-Framework suited that perfectly. There was a bit of a learning curve to get used to concepts like Serializers, API Views, etc. that Rest-Framework provides, but we feel it has allowed us to accomplish a lot of complex behaviours while maintaining a clean, modular, readable code-base.

Design

For our front-end, we were working with the awesome folks at Uncommon, who provided us gorgeous templates to work with. After lengthy discussions and evaluating various front-end frameworks, we felt none of them quite suited what we were doing, and involved too much overhead. Most front-end frameworks are geared toward making Single Page Apps and while each of our individual pages have a fair amount of complexity, we did not want to convert everything into a giant single page app, as our experience has shown that can quickly lead to spiraling complexity, regardless of the frame-work one uses.

We decided to keep things simple and use basic modular Javascript concepts and techniques to provide a wrapper around the templates that Uncommon had provided and talk to our API to get and post data. This worked out pretty well, allowing us to keep various modules separated, re-use code provided by the design team as much as possible, and not have to spend additional hours and days fighting to fit our code into the conventions of a framework.
All code, design and architecture decisions are in the open, much like how rest of our organisation works. You can see the code and the activity log in our Github account.

Features

For the most part, this beta release attempts to duplicate what we had in v10.0 of the KLP website. However, there are a few new features and few features that have not yet made it through and a number of features and improvements due in future revisions.

Aside from the API, there are a few important new features worth exploring:

  1. The compare feature available at the school and pre-school level. This allows you to compare any two schools or pre-schools.

    1. Planned Improvements: The ability to compare at all and any levels of hierarchy; a block to a block or even a block to a district etc.

  2. The volunteer feature allows partner organisations to post volunteer opportunities and events at schools and pre-schools. It also allows users to sign up for such events.

    1. Planned Improvements: Richer volunteer and organisation profiles and social sharing options.

  3. The search box on the map now searches through school names, hierarchy (district, block etc.) names, elected representative constituency names and PIN Codes.

    1. Planned Improvements: To add neighbourhood and name based location search.

  4. An all new map page powered by our own tile server.

  5. Our raw data page is now powered by APIs and the data is always current unlike our previous version which had static CSV files.

    1. Planned Improvements: To add timestamps to the files and to provide more data sources for download.

Now that we have a fairly stable new code base for the KLP website, there are a few features from the old site that we still need to add:

  1. Assessment data and visualisations of class, school and hierarchy performance in learning assessments needs to be added. The reason we have chosen not to add it just yet is because we are modifying our assessment analysis and visualisation methodology to be simpler to understand.

  2. Detail pages for higher levels of aggregation – like a cluster, block and district with information aggregated to that level.

  3. A refresh of the KLP database to bring it up to date with the current academic year. All these three have not been done for the same reason; because this requires an exhaustive refactor of the existing database to support the new assessment schemas and aggregation and comparison logic.


Aside from the three above, we have a few more features that have been designed and written but did not make it in to the current release.

  1. Like the volunteer workflow, we have a donation workflow that allows partner organisations to post donation requirements on behalf of the schools and pre-schools they work with for things these schools and pre-schools require and other in-kind donations. For example, a school might want to set up a computer lab and requires a number of individual items to make it happen. Users can choose to donate either the entire lab or individual items and the partner organisation will help deal with the logistics of the donation.


Our next release is due mid-October to include the volunteer work flow and squish bugs. Post that, we will have a major release in mid-January with the refactored databases and all of the changes that it enables and all the planned improvements listed above. And yes, we do have a mobile application on our minds too.

The DISE application will be updated with the current years data as well by November. We will also add the ability to be able to compare any two schools or hierarchies by December.

So that’s where we are, four years on. The KLP model continues to grow and we now believe we have a robust base on which to rapidly build upon and deploy continuously.

For the record, this is version 11. 🙂

The GeoBLR Sprint 1 – July 3, 6pm – 8pm

I’m excited to announce the first GeoBLR Sprint! The event is happening at The Center for Internet and Society on July 3, 6pm – 8pm. (RSVP)

During the July meetup, we are asking participants to bring their problems around maps and spatial data to the event. Some of Bangalore’s own data experts will be at the event, who will engage in a two hour problem solving exercise with the participants.

Have some map data that needs cleaning? Trouble with map projections or data formats? Looking for some data but not quite sure where to find it? Difficulty choosing colours for your map? May be we can help!

We encourage participants to get in touch with us prior to the event to talk about the issues that they would like to preset. Write to us on [email protected], or post a comment on our Meetup group, or write to me (me at sajjad dot in). We will select couple of  challenging problems and will recommend solutions for others.

http://www.meetup.com/GeoBLR/events/190931712/

See you at the event!

[mapsmarker marker=”5″]


If you are curious to know more about GeoBLR and why we are doing it, I wrote about it here.