Category Archives: Bangalore

International Open Data Charter, Consultation Meeting

When: Bengaluru, July 28, 5:30 pm

Where: The CIS office address is Number 194, 2nd ‘C’ Cross, Domlur, 2nd Stage, Bangalore 560071 (opposite Domlur Club and near the TERI building).

This is to invite you to a consultation meeting on the first public draft of the International Open Data Charter organised by CIS with DataKind and DataMeet at the CIS office in Bengaluru, on Tuesday, July 28, 2015, at 5:30 pm.

The Charter is being developed by the Open Data Working Group of the Open Government Partnership in consultation with a number of international organisations. Meant for approval and implementation by national governments, the Charter has five key principles:

– Open by Default;
– Quality and Quantity;
– Useable by All;
– Engagement and Empowerment of Citizens; and
– Collaboration for Development and Innovation.

The first public draft of the International Open Data Charter was published in end of May 2015 at the International Open Data Conference in Ottawa, and can be accessed here: http://opendatacharter.net/charter/.

Organisations and individuals are invited to submit comments directly on the Charter page, before July 31.

We are organising this meeting to discuss the context, the drafting process, and the objectives of this document, and to encourage the participants to comment on the existing text of the Charter.

We keenly look forward to your participation in the consultation meeting on Tuesday.

Francesca Recchia on Redressing Geopolitics

Among other goals this year for GeoBLR, we want to engage conversations that drift away from technical details of making maps and working with spatial data. In March, we featured Francesca Recchia to talk about geopolitics.

lbok

Francesca is an independent researcher and writer who has worked and taught in different parts of the world, including India, Iraq, Afghanistan, Pakistan, Palestine. She is interested in the geopolitical dimension of cultural processes and in recent years has focused her research on urban transformations and creative practices in countries in conflict.

Francesca spoke about her work in Kabul over the last two years around the Little Book of Kabul – exploring cultural practices by following Kabul’s own artists. Geographical and political borders and the construction of geopolitical imaginations have a profound impact on the way people think about and define themselves. She drew stories out of Mappa Mundi and Alighiero Boetti trying to connect how they reflect the geopolitical transformations of the world.

geoblr-francesca

Francesca says that the only way to understand politics and geopolitics and what this means for people in areas in conflict is to be amidst of it. This, she thinks is why one should work with artists and photographers.
Photos by Lorenzo Tugnoli

Olacabs at GeoBLR

Last week, we gathered at the Paradigm Shift cafe in Koramangala, to learn about the location data infrastructure at Olacabs.com. The meetup was particularly interesting in the light of Ola’s recent move adding autorickshaws to their offering. Location is at the center of Ola’s business.

Vijayaraghavan Amirisetty, Director of Engineering at Olacabs, introduced how they collect data in real-time from cars fitted with smartphones. With over a lakh vehicles online at any given time, Ola’s primary challenge is to build an infrastructure to allocate taxis to customers quickly and reliably. Vijay highlighted some of the issues around collecting location data via GPS and cell networks. Even though both the technologies have matured since their inception, they are highly unreliable in various scenarios. Ola uses a combination of algorithms to build a reliable layer over GPS and network. One thing to note is that the smartphones are of variable quality and the system needs to work regardless of these metrics.

olameetup

Even though Ola is using Google Play services as their location aggregator, in India, network is a bigger challenge. Quality varies from city to city and also reception within a city in unpredictable. Ola falls back to SMS, driver’s phone and a set of offline algorithms if the network is unavailable. Ola’s infrastructure is built using technologies like MongoDB, MySQL, Cassandra, Redis and Elastic Search. They are also exploring integrating web sockets and an experimental custom Android mod.

There was a lot of feedback from the audience specifically around why it is difficult for the drivers to locate the customer. Driver training is not an easy task – there are a lot of logistical and operational challenges. Vijay emphasised on the amount of work Ola does to improve the drivers’ experience with the whole process of on-boarding their cars.

Everything at Ola is realtime – why would anyone book an auto through Ola if they can just walk out and get one in less than a minute. They are continuing to improve and innovate to revolutionize transportation in Indian cities.

Autorickshaw photo CC 2.0 Spiros Vathis

GeoBLR in 2015 – Mapping Unmapped Places!

Dholera, Ahmedabad

To kick things off in 2015, we met at the offices of the Centre for Internet and Society (CIS), Bengaluru to map the unmapped/less-mapped settlements along the proposed Delhi-Mumbai Infrastructure Corridor (DMIC) project. The DMIC, a 1,483 km-long development corridor spanning several states in northern and western India, has been attracting a lot of curiosity and criticism from the national and international participants and observers. The project will have built a dedicated freight corridor, several industrial and logistics hubs, and smart cities at its completion. The project has been structured to be constructed in phases. The pilot project for an integrated smart city, Dholera Special Investment Region (SIR), is underway.

B61DDQzCUAACknX

The quality of mapping in many regions relies on a very active mapping community, or a strong interest from a collectives and local networks. We think it is important regardless to map the assets that pre-exist around the proposed sites of developments. With this in mind, we decided to take a look at the areas earmarked for the Dholera SIR (Gujarat), Shendra (Maharashtra), Mhow (Madhya Pradesh), and Dadri/ Greater Noida (NCR). The evening began with Tejas introducing the DMIC project, the scale of new development, and the need to capture these changes for years to come on OpenStreetMap (OSM). Sajjad provided a rapid tutorial on signing up for OSM, and using the browser-based map editor. The party was attended by guests at CIS as well as remotely from Bangalore and Dharamsala.

B61Hg57CIAAmBmV.jpg_large

As the party progressed, several guests ended up mapping roads, buildings, and water bodies in the Dholera region. Others chose to similarly map Shendra, and Dadri.

Data Journalism Workshop with The Hoot

On Nov 28th and 29th we did a data journalism workshop with The Hoot and the Oorvani Foundation.

We had 20 writers from different organizations come to learn about data. Including a few journalists and citizen journalists we decided to do a background on data journalism.

Then we did a data familiarity session to understand where people’s levels were.  While we did a registration form and asked specific questions about what people’s comfort with data were we wanted to make people had basic understanding of data.

The group we had was particularly new to data so we had spent a good amount of time on the basics of excel and data cleanup.

When we were ready to start exploring the dataset we used basic graphs in excel and moved toward other tools like Data Wrapper.

The 2nd day we did more with Fusion Tables and Maps. So people had a basic understanding of how to use those types of tools.

Learnings:

This was our first workshop with a crowd of mostly beginners so we spent a good amount of time on how to use tables. One participant didn’t know excel was available on their computer and had never opened the program before.  By the end she could do basic analysis and data cleanup. So we considered this to be our most accessible and productive workshop yet.

Rebuilding the Karnataka Learning Partnership Platform

The Karnataka Learning Partnership recently launched a new version of their platform. This post talks about why they are building this and also some of the features and details. This is cross-posted from their blog.

Over the past five months we have been busy rearchitecting our infrastructure at Karnataka Learning Partnership. Today, we are launching the beta version of the website and the API that powers most of it. There are still a few rough edges and incomplete features, but we think it is important to release early and get your feedback. We wanted to write this blog post along with the release to give you an overview of what has changed and some of the details of why we think this is a better way of doing it.

Data

We have a semi-federated database architecture. There is data from Akshara, Akshaya Patra, DISE and other partners; geographic data, aggregations and meta-data to help make sense of a lot of this. From our experience PostgreSQL is perhaps the most versatile open-source database management system out there, Especially when we have large amounts of geographic data. As part of this rewrite, we upgraded to PostgreSQL 9.3, which means better performance and new features.

Writing a web application which reads from multiple databases can be a difficult task. The trick is make sure that there is the right amount of cohesiveness. We are using Materialized Views in PostgreSQL. Materialized View is a database object that stores the result of a query in a on-disk table structure. They can be indexed separately and offer higher performance and flexibility compared to ordinary database views. We bring the data in multiple databases together using Materialized Views and refreshing them periodically.

We have a few new datasets – MP/MLA geographic boundaries, PIN code boundaries and aggregations of various parameters for schools.

API

The majority of efforts during the rewrite went into making the API, user interface and experience. We started by writing down some background. The exhaustive list of things that the API can do are here.

We have a fairly strong Python background and it has proven to be sustainable at many levels. Considering the skill-sets of our team and our preference for readable, maintainable code, Django was an obvious choice as our back-end framework. Django is a popular web development framework for Python.

Since we were building a fairly extensive API including user authentication, etc., we quickly realized that it would be useful to use one of the many API frameworks built on top of Django. After some experimentation with a few different frameworks, we settled on using Django-Rest-Framework. Our aim was to build on a clean, RESTful API design, and the paradigms offered by Rest-Framework suited that perfectly. There was a bit of a learning curve to get used to concepts like Serializers, API Views, etc. that Rest-Framework provides, but we feel it has allowed us to accomplish a lot of complex behaviours while maintaining a clean, modular, readable code-base.

Design

For our front-end, we were working with the awesome folks at Uncommon, who provided us gorgeous templates to work with. After lengthy discussions and evaluating various front-end frameworks, we felt none of them quite suited what we were doing, and involved too much overhead. Most front-end frameworks are geared toward making Single Page Apps and while each of our individual pages have a fair amount of complexity, we did not want to convert everything into a giant single page app, as our experience has shown that can quickly lead to spiraling complexity, regardless of the frame-work one uses.

We decided to keep things simple and use basic modular Javascript concepts and techniques to provide a wrapper around the templates that Uncommon had provided and talk to our API to get and post data. This worked out pretty well, allowing us to keep various modules separated, re-use code provided by the design team as much as possible, and not have to spend additional hours and days fighting to fit our code into the conventions of a framework.
All code, design and architecture decisions are in the open, much like how rest of our organisation works. You can see the code and the activity log in our Github account.

Features

For the most part, this beta release attempts to duplicate what we had in v10.0 of the KLP website. However, there are a few new features and few features that have not yet made it through and a number of features and improvements due in future revisions.

Aside from the API, there are a few important new features worth exploring:

  1. The compare feature available at the school and pre-school level. This allows you to compare any two schools or pre-schools.

    1. Planned Improvements: The ability to compare at all and any levels of hierarchy; a block to a block or even a block to a district etc.

  2. The volunteer feature allows partner organisations to post volunteer opportunities and events at schools and pre-schools. It also allows users to sign up for such events.

    1. Planned Improvements: Richer volunteer and organisation profiles and social sharing options.

  3. The search box on the map now searches through school names, hierarchy (district, block etc.) names, elected representative constituency names and PIN Codes.

    1. Planned Improvements: To add neighbourhood and name based location search.

  4. An all new map page powered by our own tile server.

  5. Our raw data page is now powered by APIs and the data is always current unlike our previous version which had static CSV files.

    1. Planned Improvements: To add timestamps to the files and to provide more data sources for download.

Now that we have a fairly stable new code base for the KLP website, there are a few features from the old site that we still need to add:

  1. Assessment data and visualisations of class, school and hierarchy performance in learning assessments needs to be added. The reason we have chosen not to add it just yet is because we are modifying our assessment analysis and visualisation methodology to be simpler to understand.

  2. Detail pages for higher levels of aggregation – like a cluster, block and district with information aggregated to that level.

  3. A refresh of the KLP database to bring it up to date with the current academic year. All these three have not been done for the same reason; because this requires an exhaustive refactor of the existing database to support the new assessment schemas and aggregation and comparison logic.


Aside from the three above, we have a few more features that have been designed and written but did not make it in to the current release.

  1. Like the volunteer workflow, we have a donation workflow that allows partner organisations to post donation requirements on behalf of the schools and pre-schools they work with for things these schools and pre-schools require and other in-kind donations. For example, a school might want to set up a computer lab and requires a number of individual items to make it happen. Users can choose to donate either the entire lab or individual items and the partner organisation will help deal with the logistics of the donation.


Our next release is due mid-October to include the volunteer work flow and squish bugs. Post that, we will have a major release in mid-January with the refactored databases and all of the changes that it enables and all the planned improvements listed above. And yes, we do have a mobile application on our minds too.

The DISE application will be updated with the current years data as well by November. We will also add the ability to be able to compare any two schools or hierarchies by December.

So that’s where we are, four years on. The KLP model continues to grow and we now believe we have a robust base on which to rapidly build upon and deploy continuously.

For the record, this is version 11. 🙂

Meet a DMer: Siddharth Desai

SidPhoto

Meet a DMer.

On the DataMeet list we have started referring to each other as DMers.  So I wanted to start highlighting people who are pretty interesting and have a great insights into open data.

Siddharth Desai is one of our super volunteers, he is steadfast in his commitment to helping out with Open Data  Camps and coming to any event in Bangalore that he can.  I was really happy to interview him and learn about why open data is such an interest to him.

Where are you from? What do you do?

I am from a town in Goa called Vasco-da-gama. Moved to Bangalore 10 years ago for professional reasons. Currently, I am working as a Software Architect with Nokia(formerly NSN). My job involves building solutions in the telecom domain. I do quite a bit of data analysis and visualization as part of my work. The type of data involved is mostly engineering and planning related data.

How did you find out about DataMeet?

I have been following the Open Data Movement for some time now. I realized there were some interesting things happening here in India when I saw the event notification for the first Open Data Camp in 2012. That’s when I heard about the DataMeet and have been on the list ever since.

Do you believe in open data? and why?

I believe in open data. It’s simply a great leveler. For most part of human history, the masses have been fooled and controlled because they didn’t have access to information that a select few did. Then came along Gutenberg who invented the printing press. Suddenly, knowledge could get out of the confines of a few and into the hands of many. And that empowered people and eventually led to greater equity.

The Internet and Wikipedia have done something similar in our times. The Open Data movement is another (huge) step forward in putting an end to all un-necessary information asymmetry.

What do you hope to learn? Contribute?

As part of my work, I have acquired the skills for making sense of complex data sets. I am hoping to put those skills to good use by contributing to any initiative that requires support.

Everytime I am at a data meet or data camp, I get to learn so much about life – about challenges in different non technical areas of data, like social and political contexts around data and information.

What is your impression of the datameet community?

Where else do people from such a diverse background meet. We have Academics and Hackers, NGOs and Bureaucrats, Journalists and Businessmen, Designers and more. With such an impressive line-up , there is huge potential to make an impact.

What kind of civic projects do you work on? What kinds of civic projects are you interested in working on?

Really anything that does good. Particularly, if anyone has any ideas in medical or healthcare spaces, I’d be glad to join. I’ve noticed during various illnesses in the family, that a lot of information on treatment efficacy, side effects, doctor/hospital failures, is shrouded in secrecy. This really needs to be available openly to all for closer scrutiny.

Share a visualization that you saw recently that made a big impression? Share an article you have read recently that made a big impression? (does not have to be data related)

There is this visualization by David McCandless that I love (partly because I enjoy sci-fi a lot).  It visualizes time travel in popular films and tv series. The approach to displaying a non-linear timeline is pretty creative.

Crosspost: Adding stress to a stressed area!

A few weeks ago we held an Intro to Data Journalism Workshop.  Josephine Joseph was in attendance, she regularly writes for Citizen Matters, Bangalore’s local paper that knows all.  She was working on this story and has published it last week with Citizen Matters, I’m very happy to crosspost it here as a great example of local data journalism.  

26 projects could: add 19,000 cars to Whitefield traffic, up water demand by 10.5 million litres

East Bangalore area, particularly Whitefield- KR Puram – Mahadevapura area, is on the prime real estate map. What are the projects coming up next? What are the implications?

Investing in real estate in Bangalore is a dream of any investor. However, is the growth of this sector in tune with the infrastructure that the city can handle?

A close look by Citizen Matters at 26 constructions coming up in Whitefield – KR Puram area in East Bengaluru shows some alarming observations. When the 8,000 flats are fully occupied, new residents will need 10,662.87 KL of water a day (equivalent of 1780 water tankers of 6000 Litres). More than 19,697 cars will add to Whitefield traffic.

Ministry of Environment and Forests (MoEF) rules make builders of projects of more than 20,000 sqm built up area, apply for an Environmental Clearance (EC) from the state, along with all the other permissions and NOC from BBMP, BWSSB, Karnataka Ground Water Authority (KGWA) to drill borewells prior to construction commencement.

The State Expert Appraisal Committee (SEAC) receives the applications and recommends checks and balances, prior to recommending a project for EC to the State Environment Impact Assessment Authority (SEIAA).

The SEIAA reviews project details, clarifies issues and only then is the EC issued. In cases where construction has begun without an EC, the builder is served with a show cause notice. The KSPCB can file cases against builders under the Environment Protection Act if they proceed with construction without an EC.

Read the rest over at Citizen Matters. 

Great work Josephine!

Data Journalism Workshop #1

Last Sunday, August 31st, Thej and I worked with an Economic Times Journalist Jayadevan PK to design an intro to data journalism workshop. For a while now there has been quite a bit of interest and discussion of data journalism in India. Currently there are a few courses and events around promoting data journalism, we thought there was definitely room to start to build a few modules on working with data for storytelling. Given that we have not done too many of these we decided to do an introduction and leave it limited to a few people.

Datameet1

20140831_103417

You can see the agenda with notes here and the resources we shared on the data journalism resource wiki page, as well as refer to the data catalog that DataMeet has been putting together.

Thanks to Knolby Media for hosting us and for School of Data (I am a fellow). Thank you to Vikras Mishra for volunteering and taking notes, pictures, and video.

We had four story tellers with us, from various backgrounds. We spent the morning doing introduction and what was their experience with data, what their definition of data journalism is and why they wanted to take this workshop. Then we had them put up some expectations so we can gauge what the afternoon should focus on.


20140831_155101

We then had Jaya go through the context of data journalism in terms of the world scale and the new digital journalism era.

Then we spent some time going over examples of good data journalism and bad.

After we went through resources people can use to get data. We touched upon the legal issues around using data and copyright issues. Then we discussed accuracy and how to properly attribute sources.

Then we demonstrated a few tools

Datameet 5

Tableau
CartoDB
Scraping tools
Scraper wiki
IMACROS
MapBox
QGIS

Visualization Roadmap
The participants thought understanding how to visualize would be helpful.  So we went through a sort of visualization roadmap.  Then went through stories they were working on to see how we would create a visualization and also how to examine the data and come up with a data strategy for each story.

Datameet 6

20140831_155126

Then showed some more tools to address the suggestions from the exercise.
BHUVAN
Timelines
Odyssey
Fusion Tables
BUMP

Feedback session

Datameet2
People wanted another day to let the lessons be absorbed and some more time to actually have hands on time with the tools.  Also even at the intro level it is important to make people come prepared with stories, so they have something to apply the ideas to.

To say we learned a lot is an understatement. We will definitely be planning more intro workshops and hopefully more advanced workshops in the future, we hope to continue to learn what people think is important and will keep track and see what kinds of stories come out of these learning session.

If you want a particular workshop feel free to request one here.  Stay tuned to the blog and to the list to hear about the next one.

Bangalore: Screening of The Internet’s Own Boy

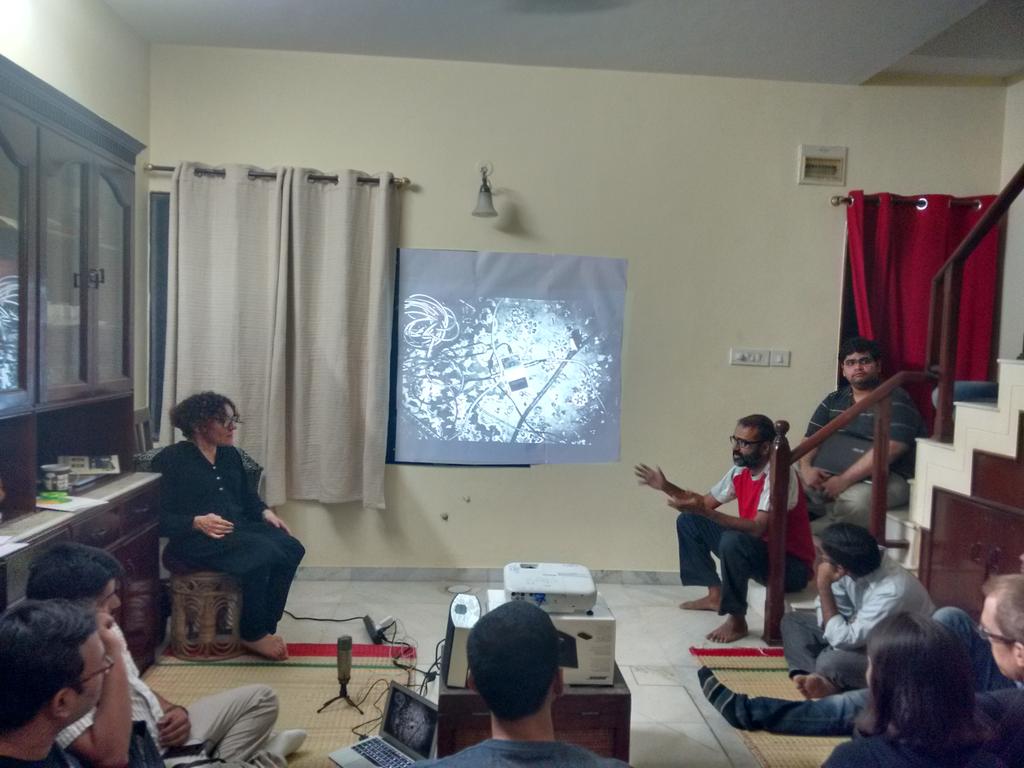
Last Thursday the Bangalore DataMeet did a screening of the Aaron Swartz Documentary: The Internet’s Own Boy.

Aaron was a developer, technologist, entrepreneur, and a passionate open culture and progressive activist, who had been instrumental in creating Creative Commons and Reddit.  Last year when he took his life in the wake of aggressive prosecution by the US Government, for downloading academic journals through MIT’s network.  The open culture/access/data movement was hit by a great loss but also had to pause and take to understand what the actions taken by the government meant.

We wanted to show the movie here and then have a discussion on the Indian context, can this happen here? Can people who believe in open access be targeted as well?  The group was small at the screening as we spent the evening discussing the THE KARNATAKA PREVENTION OF DANGEROUS ACTIVITIES OF BOOTLEGGERS, DRUG-OFFENDERS, GAMBLERS, GOONDAS, IMMORAL TRAFFIC OFFENDERS AND SLUM-GRABBERS ACT, 1985,  or better known as the Goonda Act (a Goonda is a slang term for gangster.)

The Goonda Acts are basically state level laws that provide a legal definition of what a Goonda is in several situations and prescribes ways the police are allowed to deal with them. The law in Karnataka was enacted in 1985 and had recently been amended to include new provisions including new offenders one being the digital offender.

The 1985 act includes the following:

When the Goonda Act can be invoked?

Explanation.– For the purpose of this clause, public order shall be deemed to have been affected adversely or shall be deemed likely to be affected adversely inter alia if any of the activities of any of the persons referred to in this clause directly or indirectly, is causing or is calculated to cause any harm, danger or alarm or a feeling of insecurity, among the general public or any section thereof or a grave or widespread danger to life or public health.”

What powers does the state have?

3. Power to make orders detaining certain persons.- (1) The State Government may, if satisfied with respect to any bootlegger or drug-offender or gambler or goonda or immoral traffic offender or slum-grabber that with a view to prevent him from acting in any manner prejudicial to the maintenance of public order, it is necessary so to do, make an order directing that such persons be detained.”

When is this Act valid or invalid?

(a) such order shall not be deemed to be invalid or inoperative merely because one
or some of the grounds is or are ,
(i) vague ;
(ii) non-existent ;
(iii) not-relevant ;
(iv) not connected or not proximately connected with such person; or
(v) invalid for any other reason whatsoever ;
and it is not, therefore, possible to hold that the Government or the officer making such
order would have been satisfied as provided in sub-section (1) of section 3 with
reference to the remaining ground or grounds and made the order of detention ;

How long can they detain you?

13. Maximum period of detention.- The maximum period for which any person may be detained, in pursuance of any detention order made under this Act which has been confirmed under section 12 shall be twelve months from the date of detention.

Provided that in a case where no fresh facts have arisen after the revocation or expiry of the earlier detention order made against such person, the maximum period for which such person may be detained in pursuance of the subsequent detention order shall in no case, extend beyond the expiry of a period of twelve months, from the date of detention under the earlier detention order.

How can you address the system for wrongful detention?

16. Protection of action taken in good faith.- No suit, prosecution or other legal proceeding shall lie against the State Government or any officer or person, for anything in good faith done or intended to be done in pursuance of this Act.

This Act gives the state a very powerful tool when it comes to dealing with people that have been deemed Goondas.

The 2014 Amendment added more to the list of potential offenders including people who are suspected of rape and acid attacks.  It also included a Digital Offender

What is a digital offender?

“Any person who knowingly or deliberately violates, for commercial purposes, any copyright law in relation to any book, music, film, software, artistic or scientific work and also includes any person who illegally enters through the identity of another user and illegally uses any computer or digital network for pecuniary gain for himself or any other person or commits any of the offences specified under sections 67, 68, 69, 70, 71, 72, 73, 74 and 75 of the Information Technology Act, 2000”.


Several questions come to mind:

  • How has this act been used in the past?
  • Why was there a push to include digital offenders? In some articles it seems software companies are trying to go after piracy.
  • The definitions are vague and can be used in a lot of instances.  If I send my friend a copy of a song that I have purchased, can I now be taken to jail for 12 months?

“The law applies not only to audio and video pirates, but to Facebook, twitter, Whatsapp users too. Here is how the report explains it : “If govt thinks you are planning to send a ‘lascivious’ photo to a WhatsApp group, or forwarding a copyrighted song, you can be arrested”. – One India

According to the Economic Times there is support for adding digital offender in law enforcement as well as software companies.

The Goonda Act is much more stringent and is expected to bring down the offences considerably , said a police inspector in Bangalore who has dealt with cases of offences under the IT Act. “In future, we are likely to see more offences that are digital in nature. It is probably to effectively deal with such crimes that the government has proposed this amend ment. It is more futuristic in its outlook, and is likely to help Bangalore in a big way,” said the inspector, who did not wish to be identified. According to Naidu, the very mention of the name Goonda Act creates some sort of a fear psychosis among people.

“Right now, many people seem to have a casual attitude to digital offences. If the fear of Goonda Act works, it will not just boost the sale of our products but in the process increase the tax revenues of the government,” he said.

The amendment has bolstered the confidence of Bangalore-based start-ups like MRT Studios. “We do a lot of post-production work for films, and visual effects for films and television. While we provide services to our clients by investing in original software, there are others who do the same work using the pirated software for a fraction of the price that we charge. The fear of police will now force everyone to go for legal software,” said M Naveen Kumar, 31-year old founder of the seven-month old company.

There are two sides to every law and what the Aaron Swartz’s experience shows us is that anything is possible, and that intent is not always taken into account.

How do we make sure that the intent of the law is carried out and that people without malicious intent aren’t being unfairly targeted?

How do we examine the Copyright Act and the IT Act and make sure people understand what they entail and know what  they are allowed and not allowed to do?

You can see the movie at this link.  You can see our notes from the meet up here.

Please feel free to leave a comment or add your thoughts to the hackpad.