Rebuilding the Karnataka Learning Partnership Platform

The Karnataka Learning Partnership recently launched a new version of their platform. This post talks about why they are building this and also some of the features and details. This is cross-posted from their blog.

Over the past five months we have been busy rearchitecting our infrastructure at Karnataka Learning Partnership. Today, we are launching the beta version of the website and the API that powers most of it. There are still a few rough edges and incomplete features, but we think it is important to release early and get your feedback. We wanted to write this blog post along with the release to give you an overview of what has changed and some of the details of why we think this is a better way of doing it.

Data

We have a semi-federated database architecture. There is data from Akshara, Akshaya Patra, DISE and other partners; geographic data, aggregations and meta-data to help make sense of a lot of this. From our experience PostgreSQL is perhaps the most versatile open-source database management system out there, Especially when we have large amounts of geographic data. As part of this rewrite, we upgraded to PostgreSQL 9.3, which means better performance and new features.

Writing a web application which reads from multiple databases can be a difficult task. The trick is make sure that there is the right amount of cohesiveness. We are using Materialized Views in PostgreSQL. Materialized View is a database object that stores the result of a query in a on-disk table structure. They can be indexed separately and offer higher performance and flexibility compared to ordinary database views. We bring the data in multiple databases together using Materialized Views and refreshing them periodically.

We have a few new datasets – MP/MLA geographic boundaries, PIN code boundaries and aggregations of various parameters for schools.

API

The majority of efforts during the rewrite went into making the API, user interface and experience. We started by writing down some background. The exhaustive list of things that the API can do are here.

We have a fairly strong Python background and it has proven to be sustainable at many levels. Considering the skill-sets of our team and our preference for readable, maintainable code, Django was an obvious choice as our back-end framework. Django is a popular web development framework for Python.

Since we were building a fairly extensive API including user authentication, etc., we quickly realized that it would be useful to use one of the many API frameworks built on top of Django. After some experimentation with a few different frameworks, we settled on using Django-Rest-Framework. Our aim was to build on a clean, RESTful API design, and the paradigms offered by Rest-Framework suited that perfectly. There was a bit of a learning curve to get used to concepts like Serializers, API Views, etc. that Rest-Framework provides, but we feel it has allowed us to accomplish a lot of complex behaviours while maintaining a clean, modular, readable code-base.

Design

For our front-end, we were working with the awesome folks at Uncommon, who provided us gorgeous templates to work with. After lengthy discussions and evaluating various front-end frameworks, we felt none of them quite suited what we were doing, and involved too much overhead. Most front-end frameworks are geared toward making Single Page Apps and while each of our individual pages have a fair amount of complexity, we did not want to convert everything into a giant single page app, as our experience has shown that can quickly lead to spiraling complexity, regardless of the frame-work one uses.

We decided to keep things simple and use basic modular Javascript concepts and techniques to provide a wrapper around the templates that Uncommon had provided and talk to our API to get and post data. This worked out pretty well, allowing us to keep various modules separated, re-use code provided by the design team as much as possible, and not have to spend additional hours and days fighting to fit our code into the conventions of a framework.
All code, design and architecture decisions are in the open, much like how rest of our organisation works. You can see the code and the activity log in our Github account.

Features

For the most part, this beta release attempts to duplicate what we had in v10.0 of the KLP website. However, there are a few new features and few features that have not yet made it through and a number of features and improvements due in future revisions.

Aside from the API, there are a few important new features worth exploring:

  1. The compare feature available at the school and pre-school level. This allows you to compare any two schools or pre-schools.

    1. Planned Improvements: The ability to compare at all and any levels of hierarchy; a block to a block or even a block to a district etc.

  2. The volunteer feature allows partner organisations to post volunteer opportunities and events at schools and pre-schools. It also allows users to sign up for such events.

    1. Planned Improvements: Richer volunteer and organisation profiles and social sharing options.

  3. The search box on the map now searches through school names, hierarchy (district, block etc.) names, elected representative constituency names and PIN Codes.

    1. Planned Improvements: To add neighbourhood and name based location search.

  4. An all new map page powered by our own tile server.

  5. Our raw data page is now powered by APIs and the data is always current unlike our previous version which had static CSV files.

    1. Planned Improvements: To add timestamps to the files and to provide more data sources for download.

Now that we have a fairly stable new code base for the KLP website, there are a few features from the old site that we still need to add:

  1. Assessment data and visualisations of class, school and hierarchy performance in learning assessments needs to be added. The reason we have chosen not to add it just yet is because we are modifying our assessment analysis and visualisation methodology to be simpler to understand.

  2. Detail pages for higher levels of aggregation – like a cluster, block and district with information aggregated to that level.

  3. A refresh of the KLP database to bring it up to date with the current academic year. All these three have not been done for the same reason; because this requires an exhaustive refactor of the existing database to support the new assessment schemas and aggregation and comparison logic.


Aside from the three above, we have a few more features that have been designed and written but did not make it in to the current release.

  1. Like the volunteer workflow, we have a donation workflow that allows partner organisations to post donation requirements on behalf of the schools and pre-schools they work with for things these schools and pre-schools require and other in-kind donations. For example, a school might want to set up a computer lab and requires a number of individual items to make it happen. Users can choose to donate either the entire lab or individual items and the partner organisation will help deal with the logistics of the donation.


Our next release is due mid-October to include the volunteer work flow and squish bugs. Post that, we will have a major release in mid-January with the refactored databases and all of the changes that it enables and all the planned improvements listed above. And yes, we do have a mobile application on our minds too.

The DISE application will be updated with the current years data as well by November. We will also add the ability to be able to compare any two schools or hierarchies by December.

So that’s where we are, four years on. The KLP model continues to grow and we now believe we have a robust base on which to rapidly build upon and deploy continuously.

For the record, this is version 11. 🙂
Open Data India Watch – 14

Stories

Tools

  • GeoPlanet Explorer. You can explore the geographical information provided by Yahoo in the GeoPlanet API and data set.
  • uDig is an open source (EPL and BSD) desktop application framework, built with Eclipse Rich Client (RCP) technology. The goal of uDig is to provide a complete Java solution for desktop GIS data access, editing, and viewing.
  • Geopaparazzi is a tool developed to do very fast qualitative engineering/geologic surveys. Even if the main aim is in the field of surveying, it contains tools that can be of great use also to OpenStreetMappers as well as tourists that want to keep a geo-diary. Geopaparazzi is now available on the Android Market. Search for geopaparazzi on your phone or get it from the online android market.

Stories – World

Meet a DMer: Siddharth Desai

SidPhoto

Meet a DMer.

On the DataMeet list we have started referring to each other as DMers.  So I wanted to start highlighting people who are pretty interesting and have a great insights into open data.

Siddharth Desai is one of our super volunteers, he is steadfast in his commitment to helping out with Open Data  Camps and coming to any event in Bangalore that he can.  I was really happy to interview him and learn about why open data is such an interest to him.

Where are you from? What do you do?

I am from a town in Goa called Vasco-da-gama. Moved to Bangalore 10 years ago for professional reasons. Currently, I am working as a Software Architect with Nokia(formerly NSN). My job involves building solutions in the telecom domain. I do quite a bit of data analysis and visualization as part of my work. The type of data involved is mostly engineering and planning related data.

How did you find out about DataMeet?

I have been following the Open Data Movement for some time now. I realized there were some interesting things happening here in India when I saw the event notification for the first Open Data Camp in 2012. That’s when I heard about the DataMeet and have been on the list ever since.

Do you believe in open data? and why?

I believe in open data. It’s simply a great leveler. For most part of human history, the masses have been fooled and controlled because they didn’t have access to information that a select few did. Then came along Gutenberg who invented the printing press. Suddenly, knowledge could get out of the confines of a few and into the hands of many. And that empowered people and eventually led to greater equity.

The Internet and Wikipedia have done something similar in our times. The Open Data movement is another (huge) step forward in putting an end to all un-necessary information asymmetry.

What do you hope to learn? Contribute?

As part of my work, I have acquired the skills for making sense of complex data sets. I am hoping to put those skills to good use by contributing to any initiative that requires support.

Everytime I am at a data meet or data camp, I get to learn so much about life – about challenges in different non technical areas of data, like social and political contexts around data and information.

What is your impression of the datameet community?

Where else do people from such a diverse background meet. We have Academics and Hackers, NGOs and Bureaucrats, Journalists and Businessmen, Designers and more. With such an impressive line-up , there is huge potential to make an impact.

What kind of civic projects do you work on? What kinds of civic projects are you interested in working on?

Really anything that does good. Particularly, if anyone has any ideas in medical or healthcare spaces, I’d be glad to join. I’ve noticed during various illnesses in the family, that a lot of information on treatment efficacy, side effects, doctor/hospital failures, is shrouded in secrecy. This really needs to be available openly to all for closer scrutiny.

Share a visualization that you saw recently that made a big impression? Share an article you have read recently that made a big impression? (does not have to be data related)

There is this visualization by David McCandless that I love (partly because I enjoy sci-fi a lot).  It visualizes time travel in popular films and tv series. The approach to displaying a non-linear timeline is pretty creative.

Tool Review: WebScraper

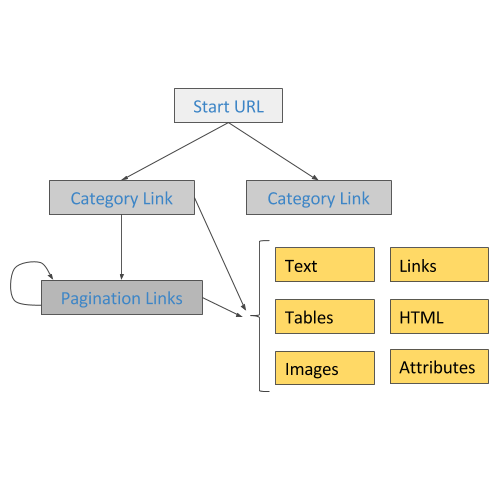
Usually when I have any scraping to do I ask Thej  if he can do it and then take a nap. However, Thej is on vacation so I was stuck either waiting for him to come back or I could try to do it myself. It was basic text, not much html, no images, and a few pages, so I went for it with some non coder tools.

I checked the School of Data scraping section for some tools and they have a nice little section on using browser based scraping tools. I did a chrome store search and came across WebScraper.

I glanced through the video sort of paying attention got the gist of it and started to play with the tool.  It took awhile for me to figure out.  I highly recommend very carefully going through the tutorials.  The videos take you through the process but are not very clear for complete newbies like me so it took a few views to understand the hierarchy concept and how to adapt their example to the site I was scraping.

I got the hang of doing one page and then figuring out how to tell it to go to another page, again I had to spend quite a bit of time rewatching the tutorial.

At the end of the day I got the data in neat columns in CSV without too much trouble.  I would recommend WebScraper for people who want to do some basic scraping.

It is as visual as you can get though the terminology is still very technical.   You have to do into the developer tools folder which can feel intimidating but ultimately satisfying in the end.

Though I’ll probably still call Thej.

Project Data Playlist

Finding ways to learn a new way to play and work with data is always a challenge. Workshops, courses, and sprints are a really great way to learn from people. While we will continue to try to bring those events to places around India we wanted to use different mediums to put up lessons, tips, techniques and tools.

There is also an additional challenge of how do we reach out to new communities and people, with different languages and ways of presenting concepts and skills.

We wanted to invite the community and others to experiment in this space by creating video skill sharing playlists.

So instead of a single 10 minute video on how to use Excel we are asking people to create playlists of videos that are between 2 to 5 minutes long that are one concept or process each video.

Anand S presents our first playlist: Formatting in EXCEL:

By breaking up the lesson into chunks and making them separate videos we are asking people add their own.

Don’t like excel? Do one for Open Spreadsheets or Fusion Tables.  Sharing your favorite tools and tricks used for working with data is the main goal of this project.

The next step is translating them into a different languages and offering different ways to teach a concept.

Next week Thej will present a intro to SQL video.

If you want to do one there a few rules:

1) Introduce yourself
2) Break up the lesson by technique and make each video no more than 2 to 5 minutes.
3) Make sure they are a playlist.
4) Upload them to youtube and tag them DataMeet
5) Let us know!

If you have any feedback or a video request please feel free to leave it in the comments. We will hopefully release 2 playlists every month.

Crosspost: Adding stress to a stressed area!

A few weeks ago we held an Intro to Data Journalism Workshop.  Josephine Joseph was in attendance, she regularly writes for Citizen Matters, Bangalore’s local paper that knows all.  She was working on this story and has published it last week with Citizen Matters, I’m very happy to crosspost it here as a great example of local data journalism.  

26 projects could: add 19,000 cars to Whitefield traffic, up water demand by 10.5 million litres

East Bangalore area, particularly Whitefield- KR Puram – Mahadevapura area, is on the prime real estate map. What are the projects coming up next? What are the implications?

Investing in real estate in Bangalore is a dream of any investor. However, is the growth of this sector in tune with the infrastructure that the city can handle?

A close look by Citizen Matters at 26 constructions coming up in Whitefield – KR Puram area in East Bengaluru shows some alarming observations. When the 8,000 flats are fully occupied, new residents will need 10,662.87 KL of water a day (equivalent of 1780 water tankers of 6000 Litres). More than 19,697 cars will add to Whitefield traffic.

Ministry of Environment and Forests (MoEF) rules make builders of projects of more than 20,000 sqm built up area, apply for an Environmental Clearance (EC) from the state, along with all the other permissions and NOC from BBMP, BWSSB, Karnataka Ground Water Authority (KGWA) to drill borewells prior to construction commencement.

The State Expert Appraisal Committee (SEAC) receives the applications and recommends checks and balances, prior to recommending a project for EC to the State Environment Impact Assessment Authority (SEIAA).

The SEIAA reviews project details, clarifies issues and only then is the EC issued. In cases where construction has begun without an EC, the builder is served with a show cause notice. The KSPCB can file cases against builders under the Environment Protection Act if they proceed with construction without an EC.

Read the rest over at Citizen Matters. 

Great work Josephine!

Notes from first Data BootCamp India

This has been crossposted from Thej GN’s blog.

“First ever DataBootCamp in India was organized by ICFJ in collabaration with Data{Meet}, HT, Hacks/Hackers – New Delhi, 9.9 School of Journalism in Delhi. It was a three-day event hosted by Bridge School of Management. It was an interesting gathering as more than 50% were from journalistic background. I have never seen such a big group of journalists in one place for three days, working in groups with people of different backgrounds.

Major part of the camp was to propose projects/stories and work on them. Group selected ten projects out of all the proposed projects. I have listed the projects below, hyperlinking to end results. If you like to see all the proposed projects then go to HackDash.

dbootcamp

  1. Narendra Modi On Twitter Vs Other Global Leaders – Word Play vs Ground Reality
  2. Crime Agaisnt Women In India
  3. Class Calculator – Think you’re in the middle class? Use the class calculator. Scroll down to find out. You may be surprised. Or Not.
  4. Cashless In India – Is India becoming a #cashlesseconomy?
  5. Terror Statistics
  6. Money poured into Ganga vs pollution levels
  7. India’s Supreme Court Ruling on Under-Trial Prisoners
  8. Media Ownership
  9. Advertising For Online Video To Rise By 30%
  10. Build Hospitals To Kill Cancer

Of course we had hands-on workshops on scraping, data cleaning, data visualization and mapping. I will probably need a series of posts to cover them all here. I have put the relevant links at the bottom for you to explore. Best part was some of the participants used the tools they learnt during the camp for their project work.

Other Interesting facts/links/tools that i came across during the event:

Overall I was surprised at the quality of the projects. At least half of them were executed very well. Two days are actually very small amount of time, so hats off to all the participants. As a participant and duct-tape programmer/trainer I had lots of fun. I hope there will be more collaborations between tech and journalism community in future.”

See Thej’s post for more pictures.  Also if you were at the event and have a post please let us know!


DataMeet is a community of Data Science and Open Data enthusiasts.