All posts by Nisha Thompson

2nd Open Data Camp Delhi!

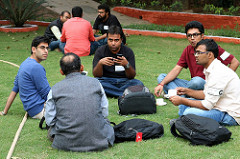
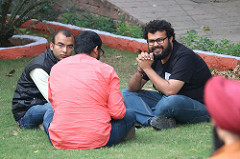
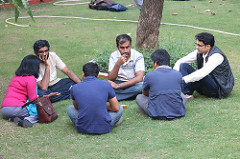
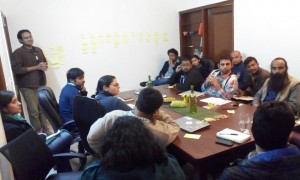
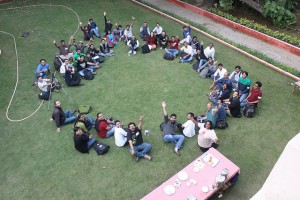
Last Su23024327289_8965388572_znday DataMeet Delhi hosted their 2nd Open Data Camp!  60 people decided to spend their Sunday with us to discuss Digital India and find ways to make this programme more Open and Transparent.

The Delhi chapter decided to examine the role of openness in Digital India, especially how the open data agenda should be integrated into the initiative.  Digital India is the flagship programme of the Government of India to harness the possibilities of information technologies for accountable governance, effective citizenship, and a productive and job-creating digital economy.

This event also explored the recent international push towards better global availability of interoperable 22569224613_8e3f363c28_zand comparable data, such as the Data Revolution for Sustainable Development initiative of UN and the International Open Data Charter introduced by the Open Data Working Group of Open Government Partnership.  The discussion looked at these wider conversation in the keynote and the morning panels.
 

22802412497_c26edf6786_z

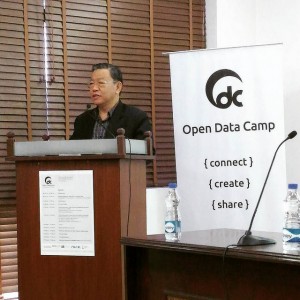
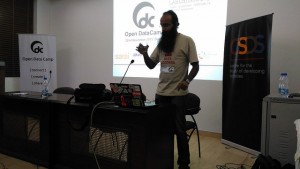
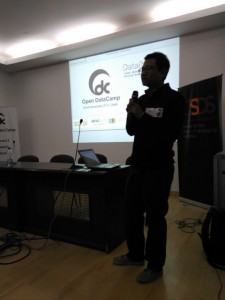
Keynote: Honourable MP from Sikkim P.D. Rai.

The MP from Sikkim started off the day by talking about his experience setting up the first state level Open Data Policy, Sikkim Open Data Acquisisiton and Accessibility Policy (SODAAP),, and why it was important for them to take control of the state’s data through openness.

He stated the the “lack of reliable, structured, and proactively available data is a key barrier to good governance.”  So the SODAAP would allow state legislators to get access to data as they need it instead of having to go through the current structure of asking the Centre for data.  “Why is it that we have fancy phones but we can’t get data on public policy & schemes on it for good decisions.”

When asked how to get government to change he stated, “I’m not the executive, I’m a lawmaker. I don’t represent the government.  I question it as much as you do.”


22878462477_005b2bb8d1_z

Open Data and Digital Governance

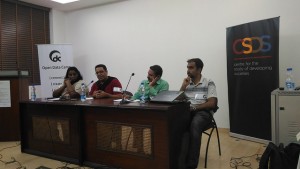
Anoop Aravind, Konatham Dileep, and Nikhil Pahwa


This panel focused on the Digital India from a government and journalistic point of view of Digital India.  The panel had a representative from Telegana, KPMG who is implementing E-Panchayats, and from Media Namma.

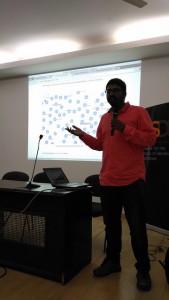
Dileep the Digital Media Director for Telegana pointed out that the government is the biggest creator of data but they are not set up to share, and are not encouraged to.  Anoop from e-Panchayats pointed out that there are technical issues with implementation and technology infiltration at the local level.  He said the biggest problem for them is the lack of mapping data that can used to help with planning.

Nikhil from Media Namma made the point that the government should proactively disclose data, “why do we need to get personal relations to get the data?” but this doesn’t replace people’s right to ask for information and not just rely on information provided by open data. Right to Information is still vital and this includes an expanded effort to protect people’s privacy.

When asked what are the challenges of openness for Digital India? That despite the big fanfare there is uneven implementation and issues that have to be solved before the dreams of Digital India are realized, and that people have to work with the government to show them the reason to be open.

22573760283_24bbf8c618_z

Open Data and Digital Citizenship 

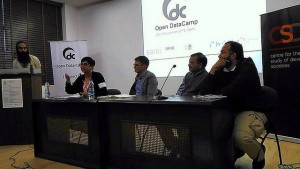
Bhanupriya Rao, Dr. Biplav Srivastava, Nic Dawes, and Shashank Srinivasan

Bhanupriya Rao an RTI activist described out RTI has a pro-active disclosure requirement, however, it is not in practice and without that RTI is the best tool for now.  There is no right to data concept.

Nic Dawes described journalism as a constitutional mandate and went on say that that open data and journalism communities must work together more.  Journalists can deal with biases, data interpretation issues, graphic presentations, and tell compelling stories using tech and design.

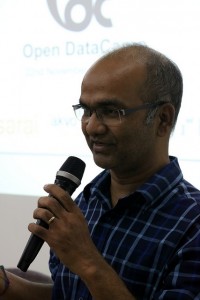
Biplav Srivastava spoke about the need to move toward smart data consumption, for policy decisions and  individual decisions. That the next steps are data integration/re-use/standards, and linked data for analytics.

Shashank Srinivasan shared his experience with open data for conservation (WWF), how they consume OSM data for needs of protecting wildlife. What are risks for crowdsourcing for wildlife conservation?  Open data can be a problem for conservation, control over the end user is needed.

Questions to consider:

How can open data improve our work? How can academia and open data converge? Can donors influence on releasing data? What does it mean to be a digital citizen?

Lightning talks

22904542059_ebbabfda5f_z

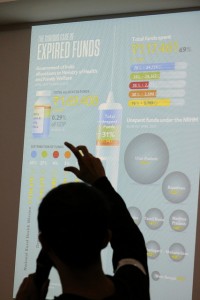
Guneet from Akvo shared their smart phone app that detects Fluoride levels in water.
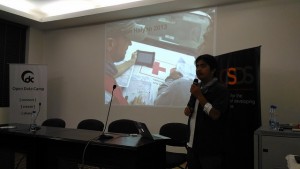


23272573835_0385565697_zManing from  HotOSM shared their work around the world providing maps during natural disasters, including the Nepal Earthquake.

23246505476_516b00ee42_z


Transport Working Group shared the work looking at bus data in Delhi.


22644205814_d6371e4e92_z

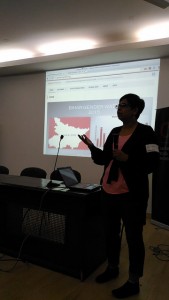
Bihar Gender Watch shared the work of looking at the gender split in elected bodies.


22644166574_0762baa26b_z


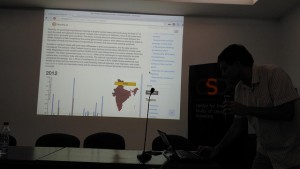
NewsPie is an online news site, they shared the data work they have done in roads and around net neutrality.


23309891061_7dd47539fb_z


Aditya Dipankar shared his work designing information.
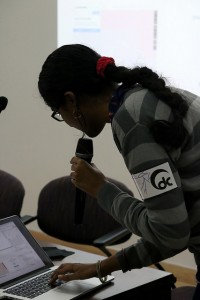


23096714180_58a2a19d0b_zAruna from MapBox shared their work mapping road naming.


23246355216_623bf9ac92_z


Turam shared his project that built more data collection tools on the Open Data Kit.


23366323936_8626537cba_z


Yogesh from Random Hacks of Kindness  (RHOK) on his vision for an open revolution! Also the work of RHOK in India bridging gaps between organizations on the ground and technologists.
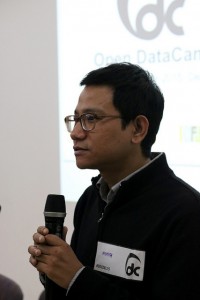


23392480785_b93d014558_zMonish Khetrimayum a PHD student spoke about big data, governance and citizenship.


22765320053_cb6f372d33_z


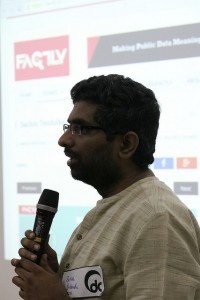
Rakesh from Factly describes how they use RTI information and open data to make sense of information for journalists and citizens.


Group Activity: Response to Digital India

23392506025_19a0dc0b66_m23096736470_c0465ba3d0_m
23024525899_51faa6ca1e_m23284061752_aa07440544_m

Groups were formed to discuss each pillar and come up with questions.

We have gathered all the questions and put them in the DataMeet hackpad, you can find each pillar here.

Please feel free to take a look and add more questions and dataset requests.

After a week’s time we will be gathering everything and writing a letter of request for openness to Digital India and the various departments, DIETY, to ask them to make this information available.

It was a fantastic day! DataMeet Delhi did an amazing job putting together really interesting speakers to make this a well rounded interactive event.

Thank you especially to the sponsors for helping make this event great!

  • SARAI for the space
  • AKVO for travel
  • ICFJ for food and other support.
  • RHOK for travel

Guest Post: Varun Goel- Releasing Data for Agriculture

RRAN_logoVarun serves as the chief data scientist at a research team led by Dr. Ashwini Chhatre, serves as the Research Node of the Revitalizing Rainfed Agricultural Network – an India wide network of NGOs, civil society organizations, researchers, policy makers and think-tanks that aim to reconfigure the nature, amount and delivery of public investments for productive and resilient rainfed agriculture. 

The Combined Finance and Revenue Accounts (CFRA) report is an annual report prepared by the office  of the Comptroller and Auditor General (CAG) of India to provides comprehensive Union and State government data on audited receipts, revenue expenditures and capital outlay for different major, minor and sub-minor heads.

Since the figures for actual expenditures on different heads may differ from actual  budget allocation by as much 15 to 20 percent, and that each state might have different procedures of auditing, the CFRA data provides reliable and fairly disaggregated figures of public expenditure, audited by a central authority.

The research team at the Revitalizing Rainfed Agricultural Network (RRAN) has scraped and processed the CFRA data from 2005-06 to 2010-11 for all general and economic services to understand statewide public investments in agriculture and allied activities, and highlight the mismatch in investment and needs on the ground.

The processed data, along with detailed information for each head can be forked here.

Although the data is only available at the state level, it can provide valuable insight on not just public expenditure in other domains such as urban development, health, central and state sponsored schemes, but also highlight the differences in budget allocation and actual spending of various government heads.

Revitalizing Rainfed Agricultural Network (RRAN) has practice and policy node that generates ground based evidence and block, district and state level for policy engagement, the research node’s objective is to generate evidence for testing key hypotheses to enable an articulation of the nature and magnitude of public support needed to fuel growth of India’s rainfed agriculture. To facilitate this, a Data Center has been set up with the aim of acquiring, reconciling, processing, visualizing and disseminating pan India datasets to assist in exploratory analysis and develop research hypothesis, backing up policy advocacy through scientifically rigorous data analysis, and implementing data-driven decision-making tools for program implementation by grass-roots level organizations.

Open Access Week – Open a Dataset with Srinivas Kodali

Cross post from Lost Programmer

Starting today it is International Open Access Week, I have been associated with concepts of open data and open access since 2012 and was hoping to bring some serious attention to it in India. This week I intend to showcase a serious of datasets which several departments of Govt. of India publishes in there web portals through NDSAP apart from Open Government Data Platform

Today’s dataset which I want to bring attention is of Indian Customs. Indian customs maintains records of every product imported and exported through land, sea and air. They publish this data through their commerce portal. They should be highly appreciated for maintaining this website and publishing the data. The data is published as per Notification No. 18/2012-Customs (N.T) dated: 5th Mar, 2012

The data being published includes origin, destination ports, name of the product, Harmonized System code of the product, quantity of product, unit quantity of the product, customs valuation of the product. For imported goods, the origin country is published instead of the port, while for export you get to know the exact destination city.

Read the rest over at Srinivas’s blog here

And if you are using the data for anything please let us know! Stay tuned for tomorrow’s release!

Open Access Week 2015 India Events

It’s Open Access Week! This week there are events around the country to celebrate openness and explore how far we have to go.

MapBox is putting up an amazing Open Data Gallery Tuesday the 20th in Bangalore. Come and hangout look at incredible art and projects from around the country!

In celebration DataMeet is doing its first MULTI CITY EVENT!

Join us Saturday 24th at 6:30pm for talks from Data.Gov.In, Ahmedabad and Bangalore with livestreaming between the cities!

  • Data.Gov.In will talk about the latest updates to Open Data in India.
  • Bangalore will discuss open access in general and open data projects.
  • Ahmedabad will talk about the status of Open Access in their part of the world.
  • Srinivas Kodali will talk about releasing datasets.

Bangalore’s event will be at Centre for Internet and Society.

Ahmedabad will be at CEPT University. 

Please RSVP on Facebook or Meetup.

Let’s celebrate all we have been able to accomplish as a community and look forward to continuing to promote a culture of openness, sharing, learning and collaboration.


Nepal Needs You to Make Maps!

Post by Tejas AP

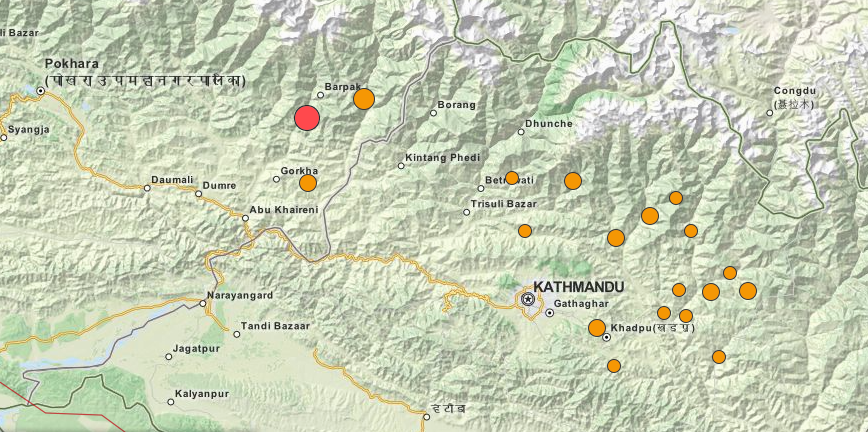
The Humanitarian OpenStreetMap Team (HOTOSM) has activated to support crisis response in Nepal after the recent devastating earthquake. A global team of volunteers is contributing to the OSM project by mapping physical infrastructure (roads and buildings) as well as traces and areas safe for crisis responders to use and congregate at. We believe improved information, especially of the remote affected areas, is crucial to improve the efforts carried out by relief agencies on-ground.

Volunteers may contribute to the map of Nepal simply by selecting a task from the wiki. Basic questions about registering and using the OSM mapping tool can be found in its comprehensive documentation here.

While the volunteers have been recording road networks and buildings at a rapid pace, we understand that the communication networks in Nepal are still being restored, and crisis responders might not have access to navigation maps to expedite their efforts. We want to help in ensuring that people have access to map data in every manner possible.

We want to print offline maps and send them with relief materials from India to Nepal. Please help us by providing us

* a list of towns/villages/regions you need maps of, and

* point-of-contact we can deliver the printed maps to.

For more information, please get in touch with

Sajjad  – sajjad(at)mapbox(dot)com

Tejas  – tejaspande(at)live(dot)com

Nisha  – nisha(at)datameet(dot)com

Prabhas – prabhas.pokharel(at)gmail(dot)com

Meanwhile, here’s some information that you might find useful  –

1. https://www.mapbox.com/blog/nepal-earthquake/
2. The News Minute report –
http://www.thenewsminute.com/article/how-group-individuals-all-over-india-are-making-maps-help-rescue-teams-nepal
3. HOT Wiki – https://wiki.openstreetmap.org/wiki/2015_Nepal_earthquake
4. KLL report – http://kathmandulivinglabs.org/blog/

{Delhi} Jan 28th Planning Meeting

Delhi DataMeet – Jan 28th

IMG-20150128-WA0005

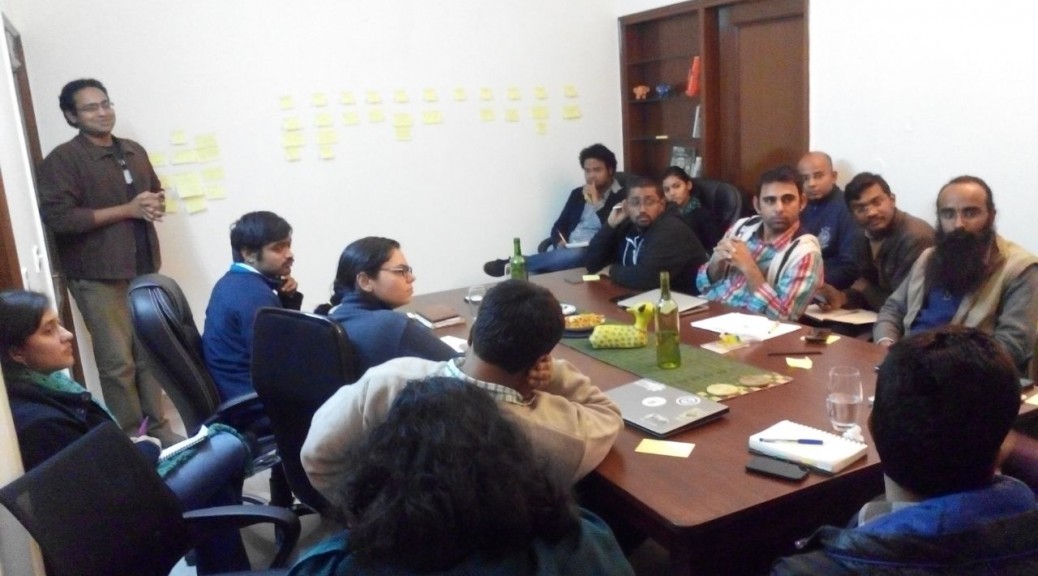
On the 28th of Jan Delhi DataMeet met to discuss their plans for the next year and to pick new organizers since Sumandro is leaving Delhi.

  • Nisha then summarized what was happening with DataMeet central and the other chapters.
  •  Amitangshu – when you think of DataMeet we think about through the sector we work in.  How does translate to the overall goal and become a common idea to all of us?
  • Updates on NIC
    • NDSAP Cell new’s head BN Satyapati
    • Data.Gov.iIn team is the team that is managing MyGov.in – resources have been moved to MygGov – can we push mygov to do open data things?  People have to suggest open data activities on MyGov.in.  Something we can do?

We started out with introductions and with the following questions.

  1. What should be the purpose of DataMeet Delhi?
  2. How can DataMeet Delhi add value to your own work?
  3. What activities/events should DataMeet Delhi do during the next year?

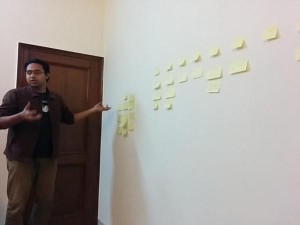
In order to find out the answer to the above questions post it notes were passed out and people were asked what they thought the purpose of DataMeet Delhi should be and what activities do they want to do in the following year.

delhidatameet

Purpose/Value

  1. awareness and knowledge about the global movement of open data – nuances/ policy/politics
  2. open data advocacy intervention in policy decision making, (think about other policies and portals in other ministries) (if you get buy in and it can move it forward) workshops, [bridging to osm – Satya] – advocating with various public officials – important thing to do.
  3.  DataMeet has members with excellent data skills – students what to learn data tools – people interested in teaching and students learning more about data skills – help people use and learn data tools- help students – basic and small workshops – Ravi
    1. when working with students – causes more due diligence – do it with an outside audience  –
    2. hold them in north and south campus – in a college.
    3. focused result workshops with journalists – focused with practical ends – training
    4. Student Workshops – Ravi, Krishnan, Nisha, Guneet,  will work together to plan a few for March, April
  4. open community, talks, organization, regular talks, conference
  5.  act like a platform – teach learn and doing
  6. talks, half day and 1 day hacks, areas to work, data entreauapneirship, public policy (budget state and local) – WASH, tie up with startups  – startups and private sector come in and talk about their issues and using data – start up tie in does help with advocacy – lobbying/legal political advisories – open source data conversation
    1. let’s think about specific audiences, there are so many catalogues – list of all the catalogues of different sources and mash up data
    2. use gov data, collect public data and speak with them about publishing data, data tools service
  7. team up with non for profits and help them solve their problems – break thru -woman’s group – support them  – ashoka, idrc, go thru them and see who needs help  – later in the year – happy to solve them – take them up as they challenging etc
    1. Non Profits –  submit problems and we can take them up as they come up and make that a focus on the DataMeet
    2. helping NGOS – on board with what they want to achieve – figure out the larger things
  8.  data problems – data successes – inspire and learn and connect
  9. work more with start ups – spread open data ideas
    1. side meetings – working with gov, ngo’s and startups – sumandro, raman,
  10. work with lamp fellows, prime minister rural fellows
    1. Government  – we should be willing to help the government as well – government isn’t easy to work with and is time intensive

TEACHING, LEARNING, DOING – The above purpose and values can be categorized under this mantra.

  • teaching students
  • doing advocacy and ngo solves problems
  • compiling casestudies
  • give rewards – push it to happen
  • make sure datameet gets credited
  • open data success stories

CALENDAR 

Feb –

    • Gurgoan budget data – Namrehta – interested in knowing more about what is happening – ongoing – state prs people – ADR – state chapter – city budget – ties into the overall state budget – income into city from state – and vice versa – long campaign – filing a PIL – ongoing – do a non profit – learning training thing
    • Assembly election in FEb

March

  • budget data ramanjit cheema,- bring groups who work on budget together – AI, CBGA
  • out in the open themed pecha kucha

June

  • capacity building with civil society groups
  • session of learning and- need to dismystify the tech heavy agenda of the group

July

  • AKVO event – water sanitation – manifesto what are the data gaps – bring them together – talk about data and shareing and advocacy – formats – INdia Wash Forum

 Oct

  • Public transport data – Guneet, Namrehta,

 Dec

  • Malnutrition

 Nov

  • Open Data Camp

 New Organizers of Delhi Data Meet!!!

Guneet, Isha, and Prachi!!!

Thanks to everyone for a great meeting! If I missed anything please add to the comments!


Data Expedition: Do Din Edition

Do Din is an Hyderabad City Event focused on looking at how Hyderabad is progressing and changing. The organizers Hyderabad Urban Labs and Right to the City have this event every year to create a space to allow people to exchange ideas, understand problems, and share solutions for different aspects of urban life.

As part of my fellowship with School of Data I thought, Do Din would be a great place for us to have our joint data event. We worked with Do Din to make Hyderabad related datasets available and people familiar with those datasets, while DataMeet and School of Data runs the event and provide experts in mapping and design.

We had almost 30 participants throughout the day, from various backgrounds. We explore what data was and the issues around getting it and using it.

Then we looked at the data we had available. We focused on 3 data sets.

  1. Bus Transport data – routes, stops, types of buses, and income of buses.
  2. Slum data – location of slum
  3. Complaints registered regarding lakes in the city.

These were the cleanest and most accessible datasets.

After going through the data and working out the confusing unclear parameteres we split into groups to start working on datasets.

5 groups were there and each worked on a data set.

  1. Group one worked on slum data
  2. Group two worked on the lake data
  3. Group three also worked on the lake data
  4. Group four worked on the slum data
  5. Group five worked on the bus data.

Each group had a mix of technical, design, analytical, coder skills. So we were excited to see the various outputs.

After working through the data each group presented their outputs.

Group One

Produced a basic map of slums and population

Group Two

They had mapped the lakes and then did analysis based on what complaints were registered to each lake.

Group Three

Used Carto DB to make a map of the lakes

Group Four

Made a map of the slums.

Group Five

Did analysis on which types of bus made the most money over the course of their trips.

Learnings

While the outputs were great it was a fantastic exercise in working with datasets and different types of people. Probably one of the best data related events we have hosted.

Data Journalism Workshop with The Hoot

On Nov 28th and 29th we did a data journalism workshop with The Hoot and the Oorvani Foundation.

We had 20 writers from different organizations come to learn about data. Including a few journalists and citizen journalists we decided to do a background on data journalism.

Then we did a data familiarity session to understand where people’s levels were.  While we did a registration form and asked specific questions about what people’s comfort with data were we wanted to make people had basic understanding of data.

The group we had was particularly new to data so we had spent a good amount of time on the basics of excel and data cleanup.

When we were ready to start exploring the dataset we used basic graphs in excel and moved toward other tools like Data Wrapper.

The 2nd day we did more with Fusion Tables and Maps. So people had a basic understanding of how to use those types of tools.

Learnings:

This was our first workshop with a crowd of mostly beginners so we spent a good amount of time on how to use tables. One participant didn’t know excel was available on their computer and had never opened the program before.  By the end she could do basic analysis and data cleanup. So we considered this to be our most accessible and productive workshop yet.

Data On the Ground: Crosspost from India Water Portal

From India Water Portal.  Communities using planning, data and collaboration to take control of their water security.  

Excerpt

What stands out in Dholavira, is the attention to detail when it came to collecting and storing water. More than 16 reservoirs are said to exist on this 100 hectare site, of which 5 have been excavated. While these reservoirs harvested rainwater, an elaborate system of drainage channels was planned to ensure that all the runoff collected in these tanks. “See this reservoir,” Raujibhai says, “it has a well inside it so that even if the tank dries up, the well will supply water”. There is also a standalone well and a seasonal stream, which was dammed at multiple points to harvest water.

Their water mantra was simple: collect and store water locally and conserve it to provide fresh water. This continues to be relevant even today for the 1.7 lakh people who live in Rapar, the taluka where Dholavira is located.

Rainfall map of India. Historically, Rapar has received poor rainfall. (Source: IWP)

Rainfall map of India. Historically, Rapar has received poor rainfall. (Source: IWP)

This has been proven by Samerth, an organisation that has worked with communities in 20 Gram Panchayats in Rapar to create structures that can store 64 million cubic feet of water. What are the elements that are common? How is Rapar’s water security now?


Read the rest of this amazing story here.