Category Archives: Reports

Open Data India Watch – 9

Stories

Tools/Tutorials

Events

Open Data India Watch – 7

Stories

Stories – World

Events

  • GeoBlr – Meetup – PINCODE EXTRAVAGANZA! is on Aug 12. Please do RSVP.
  • Monthly DataMeetUp Delhi is on Aug 27
  • DataBootCamp India -Hack the Budget at the capital’s biggest data journalism event yet, between September 5-7. The Open Data Bootcamp is co-hosted by the International Center for Journalists, the Hindustan Times, Hacks/Hackers New Delhi, Data{Meet}, and the 9.9 School of Communication. The three-day event will take place at the Bridge School of Management at Cyber City in Gurgaon.

Suggest stories to us

You can suggest stories, applications, events etc by tweeting at @datameet or by emailing.

Open Data India Watch – 6

Stories

Events

Tools

  • MapShaper enables online editing of Shapefile .shp, GeoJSON or TopoJSON files.
  • The GDELT Project monitors the world’s broadcast, print, and web news from nearly every corner of every country in over 100 languages and identifies the people, locations, organizations, counts, themes, sources, and events driving our global society every second of every day, creating a free open platform for computing on the entire world.

Notes from DataMeet-Up in Delhi, 31 July 2014

After a long hiatus, we had a DataMeet-Up in Delhi on Friday, July 31. Thanks to the Centre for Internet and Society for hosting us.

The meet-up had a small but very productive mix of old and new faces. Here is the list of participants:

* Deeptanshu
* Guneet Narula, Sputznik
* Isha Parihar, Akvo Foundation
* Namrata Mehta, Center for Knowledge Societies
* Praachi Misra, Competition Commission of India
* Rajat Das, Contify
* Riju / Sumandro Chattapadhyay, ajantriks.net
* Rohith Jyotish, Centre for Budget and Governance Accountability
* Shobha SV, Breakthrough

We started with a round of ‘what is DataMeet’ and moved into ‘what should DataMeet do in Delhi.’ Here are the suggestions that came up in the meeting:

1. Data Liberartion Strategy: We can work towards creating a strategy and workflow to undertake data liberation tasks. These tasks can focus on two types of data – (1) data that is not available in public yet and needs to be brought out by requesting the authorities concerned and/or speaking to them about it, and (2) data that is available in public but not in an open / directly-usable / machine-readable manner. We of course have done some work towards especially the second type of data, such as with MP constituency boundaries shapefile and with scraping of weather data. It will be useful to prepare and document strategies for such tasks.

Deeptanshu suggested that an important available-but-not-machine-readable data that we can work with in near future is the proceedings of the parliament published in the parliament’s website. We can possibly speak to ADR and PRS if they have done any work towards converting that data to machine-readable formats.

2. Learning and Sharing: We felt that DataMeet should undertake pedagogic functions – from internal training / sharing sessions within the DataMeet members, to public workshops for data and visualisation tools and techniques, to online documentation of the same. It seems that the existing (regular or otherwise) members of Delhi chapter of DataMeet is a good mix of those who look forward to pick up data / visualisation / programming skills and those who can offer to teach that. Often the latter group looks forward to learn about available datasets, ways of interpreting government data (from NSSO to budget sheets), and legal considerations associated with data — all of this the former group (who wants to learn data / visuaisation / programming skills) can offer to help with. Hence it make a lot of sense to convert our monthly meet-ups into short learning and sharing sessions.

Further, we can document the learning and sharing taking place in the meet-ups and put it up as online references. This will slowly create a knowledge base, with contributions from across the city chapters. There was a short discussion if we should use a Wiki to create such a knowledge base or a WordPress blog. The programming group is more comfortable with the former, while the non-programming group is more comfortable with the latter. With WordPress providing detailed ‘edit history,’ I guess it is alright to use WordPress for the sake of general ease of use.

Let us start the documentation over the next 3-4 meet-ups and think of what is the best way to upload it – either as a section of DataMeet blog / wiki / github or a sub-site.

3. DataMeet-Ups as Tiny Hackathons: It was suggested that on each DataMeet-Up, we take up a particular task — either of data liberation or of data visualisation — and focus on a particular topic and dataset, and spend time together working on the task. This will include thinking about the task, creating a workflow, sharing the skills concerned, and doing the task. And finally we showcase the work done through the DataMeet blog and elsewhere.

Further, this will also produce visible evidence of the government data made available at the portal being actually used, and thus to raise awareness of the available data and its demand.

4. Legal and Policy Discussion: It was briefly mentioned that some members of the group often face questions related to legal and policy context of open government data, and also regarding opening of non-governmental data. We should look for resource persons and organisations to advise on such issues. The DataMeet mailing list can also function as a primary discussion space for these topics. However, the mailing list can be too public a space for certain discussions.

Open Data Camp Delhi 2014

We had an initial chat about organising the Open Data Camp in Delhi in November 2014. The date and venue discussion is pending. We will take that up in the next DataMeet-Up.

The two primary objectives of the Open Data Camp Delhi are (1) a social and networking event for open data people (who are talking about and/or working with open data ) in Delhi, and (2) learn about their interests and challenges and prepare the road plan for Delhi chapter of DataMeet. Clearly, the first objective is more community-facing, and the second one is DataMeet-facing.

Here is the draft agenda for the Open Data Camp Delhi:

09:30-10:00 Ice-Breaker
10:00-10:30 Open Data and DataMeet [What is open data? What is DataMeet? Why is DataMeet? Why is open data relevant?]
10:30-11:30 Lightning Talks #1 [6 talks of 8 minutes each]
11:30-12:00 Tea/Coffee
12:00-13:00 Lightning Talks #2 [6 talks of 8 minutes each]
13:00-14:00 Lunch
14:00-16:00 Open Data Matchmaking Session [We set up two boards at the beginning of the day. One for writing down what data project one has in mind and what skills are required, and the other for writing down what data skills one can offer. On the basis of this, people meet up during the matchmaking session and talk about their plans.]
16:00-17:00 Closing and Thanks followed by Tea/Coffee
17:00-18:00 DataMeet Roadmap Discussion [Open to anyone who wants to participate]

It was suggested that lightning talks should be chosen as a combination of directly selected (by organisers) and community selected (through a submission and voting mechanism) modes.

DataMeet-Up in August 2014

We planned the next Delhi DataMeet-Up to take place on Wednesday, August 27, afternoon, where we will work on visualising datasets related to budget 2014. Rohith from CBGA, and his colleagues, will help us select the datasets and interpret them.

The venue is yet to be decided. Possible options are Akvo, CKS, Sarai, and Youth Ki Awaaz. Maybe CBGA can host it too.

Further, this also works as a warm-up session towards the Hack the Budget event being organised by World Bank in September.
Subscribe to Blog via Email

Enter your email address to subscribe to this blog and receive notifications of new posts by email.

Open Data India Watch – 5

Stories

Events

Subscribe to Blog via Email

Enter your email address to subscribe to this blog and receive notifications of new posts by email.

Open Data India Watch – 4

Stories

Events

Opportunities

  • GDN NEXT HORIZONS ESSAY CONTEST 2014 by Gates Foundation.

    Data and information technology: There is growing excitement about the power of open data as a tool both to inform policy and spending decisions and to hold governments to account for commitments they make. What will this data and technology driven transformation in the development project “marketplace” actually look like?? How might citizens use data to provide feedback on government services and development projects? What will it take to get there?

OPEN DATA INDIA WATCH – 3

Stories

  • Census of India – Digital Library has published all the state boundaries. They are in PDF format.
  • >API for getting Current daily price of various commodities from various markets (Mandis). The data refers to prices of various commodities. It has the wholesale maximum price, minimum price and modal price on daily basis. This dataset is generated through the AGMARKNET Portal (http://agmarknet.nic.in), which disseminates daily market information of various commodities.
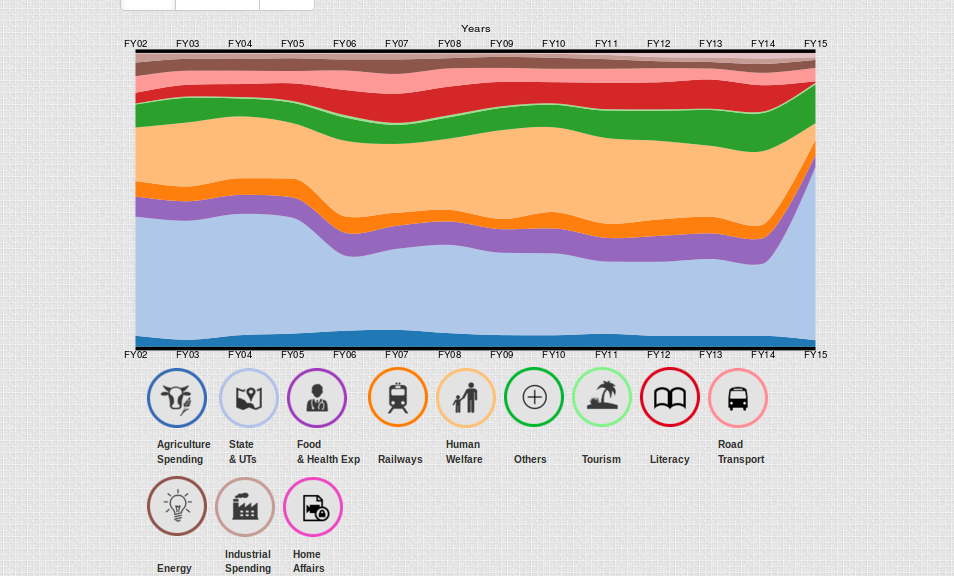
  • Economictimes has budget distribution visualizations
  • How does markets react to Budget by Gramener. Every year, on the day of the budget, the share market shows considerable movement. For example, in 2007, every sector fell with the exception of Tobacco. The same happened in 2009 as well. But in 2010, every sector except Tobacco rose.Similarly, almost every banking stock fell in 2012 with the notable exception of HDFC, whereas in 2010, almost every banking stock rose. Tobacco (which is dominated by ITC) has grown on every budget day since 2004, except in 2010 and 2013. On the other hand, Media & Entertainment has shrunk in every budget, except in 2011 and 2012.
  • Poor Sanitation in India May Afflict Well-Fed Children With Malnutrition This research has quietly swept through many of the world’s nutrition and donor organizations in part because it resolves a great mystery: Why are Indian children so much more malnourished than their poorer counterparts in sub-Saharan Africa.
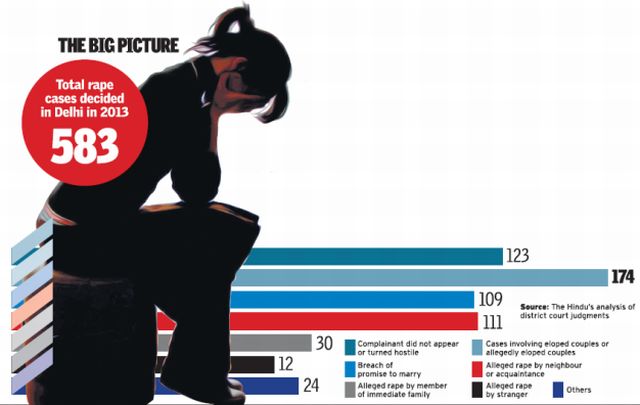
  • Visualizations: CRIME HOTSPOTS IN INDIA – Crimes Against Women
  • Pykih produced India Budget 2014 Viz. for FirstPost.com. The major challenge of this project was that we had to fetch data from Twitter and National Stock Exchange, clean it, analyse, model it and push it to CDN live, minute after minute in an extremely robust fashion.

Tools/Learning

  • Odyssey.js is an open-source tool that allows you to combine maps, narratives, and other multimedia into a beautiful story.
  • Coursera has new course:- Metadata: Organizing and Discovering Information: Metadata is an unsung hero of the modern world, the plumbing that makes the information age possible. This course describes how Metadata is used as an information tool for the Web, for databases, and for the software and computing applications around us.
  • Mapping Digital Media: India – Report. The Mapping Digital Media project examines the global opportunities and risks created by the transition from traditional to digital media. Covering 60 countries, the project examines how these changes affect the core democratic service that any media system should provide: news about political, economic, and social affairs.

Projects

  • People are denied access to research hidden behind paywalls every day. This problem is invisible, but it slows innovation, kills curiosity and harms patients. This is an indictment of the current system. Open Access has given us the solution to this problem by allowing everyone to read and re-use research. We created the Open Access Button to track the impact of paywalls and help you get access to the research you need. By using the button you’ll help show the impact of this problem, drive awareness of the issue, and help change the system. Furthermore, the Open Access Button has several ways of helping you get access to the research you need right now.

OPEN DATA INDIA WATCH – 2

Stories

  • Hindu has a timeline of Indian Financial Ministers as part of budget article. Its been done using KnightLab’s timeline framework. Here is the direct link and source of the published Google Doc used for generating.
  • Controlled Vocabulary Services by Government of India. Useful if you want to standardize names in your project.
  • Devdatta Tengse presents SouthSideUp – Maps to Show A web mercator map with south Up and North at the Bottom.
  • Stories from a Database | Despair and Hope At Chhota Gubbara, which caters to tiny newborns, we had 101 babies. 55 were boys. 46 were girls. Not bad! Especially considering that the sex ratio at birth in Uttarakhand is an alarming 886 girls to 1000 boys, our figures seem to indicate that parents are almost as likely to seek help for their newborn girls as for their newborn boys. Statistically, in fact, the difference was insignificant.
  • Accessing Open Data Portal (India) using APIs by R-Bloggers – Most of the data-sets on the portal are available for manual download. Some of the data-sets though are also available to be accessed using APIs. In this post, I’ll go over how to access that data using APIs (specifically JSON API) in R.Again, the variety of R packages available makes this a not so difficult task. I’ve made use of mainly these packages – XML, RCurl, RJSONIO, plyr.
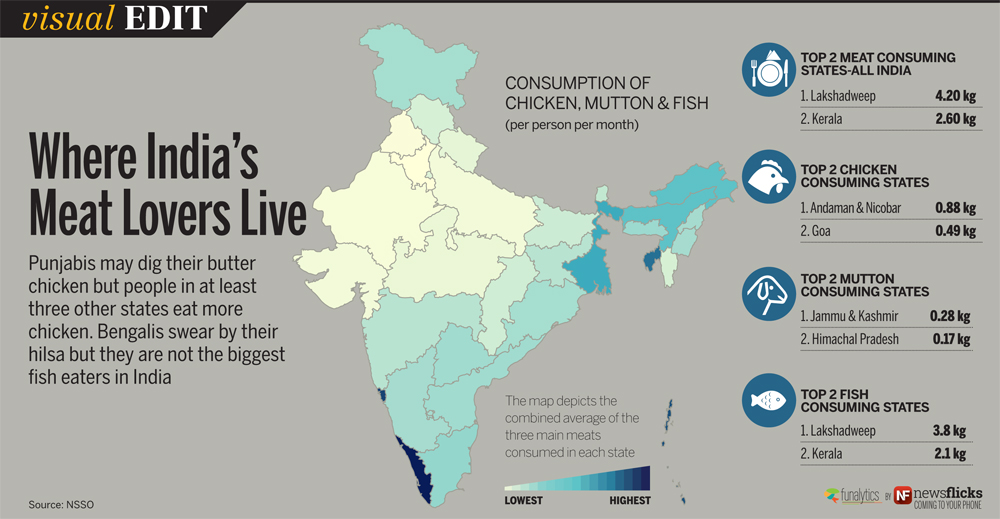
  • A look at how income affects consumption habits By Rukmini S and Sriram Sivaraman. Last week, the National Sample Survey Office, India’s official source of regular large-sample survey statistics on consumption, employment and other core socio-economic issues, put out its 558th report. The report is based on a nationally representative sample of over 1 lakh households in every state and UT, and measures the levels of consumption of various goods and services. As we’ve noted in the paper, the data points to a big revival in the functioning of India’s Public Distribution System. We also looked at how income circumscribes India’s food choices. That second story is the one we wanted to look at a little more closely today.
  • National Natural Resources Management System (NNRMS) has defined standards for GeoSpatial Data for India and its called NNRMS STANDARDS – A National Standard For EO Images, Thematic & Cartographic Maps, GIS Databases And Spatial Outputs (PDF).
  • Here’s why Tamil Nadu, Maharashtra, UP roads are death traps By Rukmini S and Sriram Sivaraman. The National Crime Records Bureau – India’s official source of police statistics – released its numbers for the last year earlier this week. One major part of the findings are, of course the crime statistics, particularly to do with crimes against women. But another fascinating part is what the police terms as ‘accidental deaths’, a catch-all phrase that covers everything from being bitten by a dog to a bomb explosion and suicides.
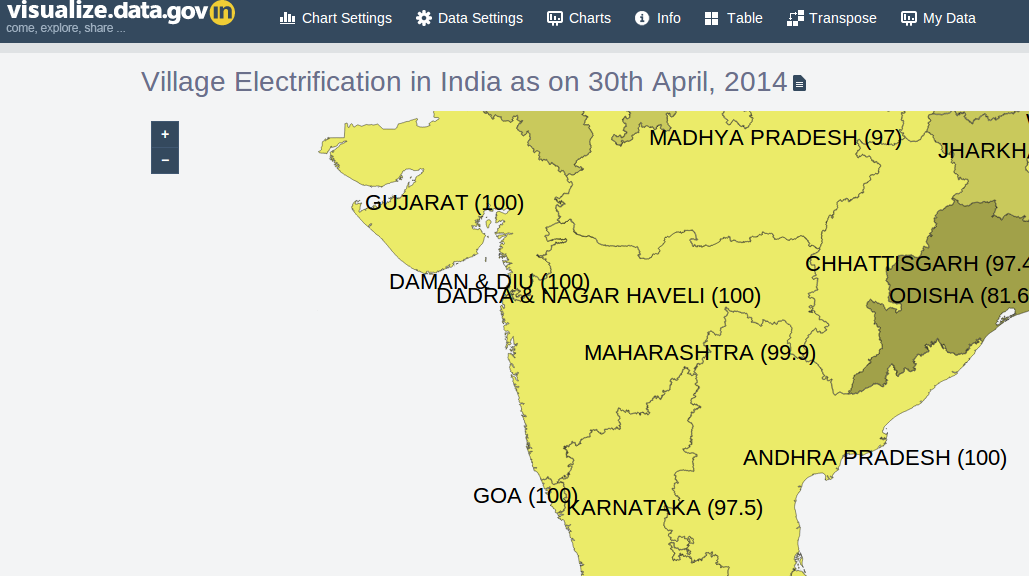
  • Data.Gov.In has a new visualization Engine to explore and visualize data. You can also add your data to enhance the visualization.

Data

  • Young Lives: School Survey, India, 2010-2011 – A school survey was introduced into Young Lives in 2010, following the third round of the household survey, in order to capture detailed information about children’s experiences of schooling. It addressed two main research questions:1. how do the relationships between poverty and child development manifest themselves and impact upon children’s educational experiences and outcomes? 2. to what extent does children’s experience of school reinforce or compensate for disadvantage in terms of child development and poverty?

World

  • No open data? No problem. 5 ways entrepreneurs are fueling open data in the developing world – On the entrepreneurial side, the World Bank’s Open Finances team has been exploring the commercial value of open data, and looking for opportunities to support entrepreneurs. These goals are achievable thanks to governments who have fostered innovation around public data by taking the step to open it. What happens when governments haven’t yet opened public data? Is it possible for entrepreneurs to take advantage of open data where it does not exist?
  • Alberto Cairo: Data journalism needs to up its own standards– The data visualization expert argues that FiveThirtyEight and Vox have overpromised and underdelivered — and that they need to treat their data with more scientific rigor.

Open Data India Watch – 1

Stories

Mapping Access to Toilets between Social Groups | Data Stories
The map below reflects that difference in access across districts. For each district, I calculated the percentage of dalit/tribal households with access to a toilet at home. I did the same calculation for households which were neither dalit nor tribal, as classified by the census. By dividing the two, we get a measure of how disparate the access is. For instance, in the district of Budaun, where the crime occurred, 15% of dalit homes according to the 2011 census, had access to a toilet at home, compared with 35% of non-dalit or non-tribal homes. This gives me a disparity measure of about 0.43 (15% divided by 35%). And so on for each district.

Why Punjab still holds aloft the flag of ‘new politics’
While the entire country appeared unimpressed by the Aam Aadmi Party and its promises, Punjab not only sent four of its candidates to the Lok Sabha, but as recent data shows, also overcame the rural-urban divide in its mandate for the party. Srinivasan Ramani explores why.

El Nino may cause weak monsoon & high prices; poses serious challenge to Modi government
As the chart on the next page (El Nino and the Indian Monsoon…) shows, strong El Nino conditions (the shaded region to the right) usually occur along with a weak monsoon. But note that there have been cases, most notably in 1997, when a very strong El Nino was accompanied by a normal monsoon.

Here’s What a Polarized Vote Looks Like
The chart below shows what that change means in a visual sense. It looks at the vote share of the biggest party in each of the 1500 or so polling stations in the constituency, and then plots those values according to how often they occur. So for instance, there were a relatively few polling stations where the largest party got 40% of the vote or below. There were many more with 60% or more of the vote in a booth. And so on. The number of polling stations where the largest party received any given vote share (from 0 to 1), can be read off the y-axis.

Average Daily Wage Rate in Rural India is up on data.gov.in for you to explore.

GoeBlr meet up in Bangalore

Other Good Reads

Visualizing Algorithms : Algorithms are a fascinating use case for visualization. To visualize an algorithm, we don’t merely fit data to a chart; there is no primary dataset. Instead there are logical rules that describe behavior. This may be why algorithm visualizations are so unusual, as designers experiment with novel forms to better communicate. This is reason enough to study them.