Mumbai Meet 4: Data Cleaning

Mumbai had it’s fourth data meet on December 6, 2014 with a total of 11 participants. Due to scheduling issues, the November meet-up was moved from last Saturday of the month to the first Saturday of December. This time the meet-up was held at Pykih’s office on 8th floor at Sardar Patel Institute Of Technology.

The speaker was Bhavin Dalal, Senior Technology Manager, from Hansa Cequity.
At Cequity, he plays multiple role not limiting to solution architect, consultant & project manager. While he has strong product framework knowledge , his expertise lies in data warehousing technologies.

Bhavin spoke on two main topics:

1. Data Cleaning – he explained what is Data Quality and which factors determine the quality of data. He briefed through the common Data quality problems faced while cleaning the data. He showed us an example where they faced problems while cleaning car data and how they solved it. He also explained data cleaning methods which will helped us to understand the approaches towards data cleaning, the importance to do data cleaning and some do’s and don’t while capturing data.

hackpad.com_xTJK5Fc0sHK_p.289611_1417935960370_IMG_20141206_184805625

2. Visualising census data for better understanding India – here he gave us eye popping fact list revolving around the census data. This topic gave us the better understanding that there are plethora of data points which can be meaningfully used to come up with really good insights on Indian population.

hackpad.com_xTJK5Fc0sHK_p.289611_1417936009366_IMG_20141206_184735045

The next data meet will be held on last Saturday of December 2014. Please follow the Mumbai Meet-Up Group to know about the details.

Data Journalism Workshop with The Hoot

On Nov 28th and 29th we did a data journalism workshop with The Hoot and the Oorvani Foundation.

We had 20 writers from different organizations come to learn about data. Including a few journalists and citizen journalists we decided to do a background on data journalism.

Then we did a data familiarity session to understand where people’s levels were.  While we did a registration form and asked specific questions about what people’s comfort with data were we wanted to make people had basic understanding of data.

The group we had was particularly new to data so we had spent a good amount of time on the basics of excel and data cleanup.

When we were ready to start exploring the dataset we used basic graphs in excel and moved toward other tools like Data Wrapper.

The 2nd day we did more with Fusion Tables and Maps. So people had a basic understanding of how to use those types of tools.

Learnings:

This was our first workshop with a crowd of mostly beginners so we spent a good amount of time on how to use tables. One participant didn’t know excel was available on their computer and had never opened the program before.  By the end she could do basic analysis and data cleanup. So we considered this to be our most accessible and productive workshop yet.

OpenDataCamp Delhi 2014 in Tweets


https://twitter.com/ajantriks/status/533225676774449152


https://twitter.com/Sramach9/status/533465685624913920


https://twitter.com/Shobha_SV/status/533473456147664896


https://twitter.com/Sramach9/status/533475979570585600


https://twitter.com/Shobha_SV/status/533478678382919682


https://twitter.com/Shobha_SV/status/533479268425023488


https://twitter.com/Shobha_SV/status/533479741232119808


https://twitter.com/Shobha_SV/status/533480948361228290
https://twitter.com/Shobha_SV/status/533484852734349312


https://twitter.com/Sramach9/status/533491064523743232
https://twitter.com/ZahirKoradia/status/533491133335105536


https://twitter.com/Sramach9/status/533501991201153026


https://twitter.com/Shobha_SV/status/533504601379442688


https://twitter.com/Shobha_SV/status/533505132206370817


https://twitter.com/Shobha_SV/status/533506490640777218


https://twitter.com/Shobha_SV/status/533507470870589441


https://twitter.com/Shobha_SV/status/533508246233829376


https://twitter.com/Shobha_SV/status/533509041427722242


https://twitter.com/Shobha_SV/status/533511798700654593


https://twitter.com/Sramach9/status/533513382054199296


https://twitter.com/ZahirKoradia/status/533517016200904705


https://twitter.com/Sreechand/status/533522447799042049


https://twitter.com/Shobha_SV/status/533523564872220672
https://twitter.com/Shobha_SV/status/533524293879988225


https://twitter.com/mtwestra/status/533526864233771009


https://twitter.com/ZahirKoradia/status/533528993450844161


https://twitter.com/ysprem/status/533530134859374593
https://twitter.com/Sramach9/status/533549017167179776
https://twitter.com/Sramach9/status/533549424761245696


https://twitter.com/Sramach9/status/533557403997200384


https://twitter.com/ayushkray/status/533585062512443392


https://twitter.com/rohithjyo/status/533628393678319616

Open Data India Watch – 18

Stories

  • The Music Timeline shows genres of music waxing and waning, based on how many Google Play Music users have an artist or album in their music library, and other data (such as album release dates). Each stripe on the graph represents a genre; the thickness of the stripe tells you roughly the popularity of music released in a given year in that genre. (For example, the “jazz” stripe is thick in the 1950s since many users’ libraries contain jazz albums released in the ’50s.) Click on the stripes to zoom into more specialized genres.
  • Two-thirds of prison inmates in India are undertrials
  • North elects more women MLAs Bihar, Haryana and Rajasthan have the highest proportion

Tools

  • SlimerJS A scriptable browser for Web developers/scrapers

Open Data India Watch – 16

Stories

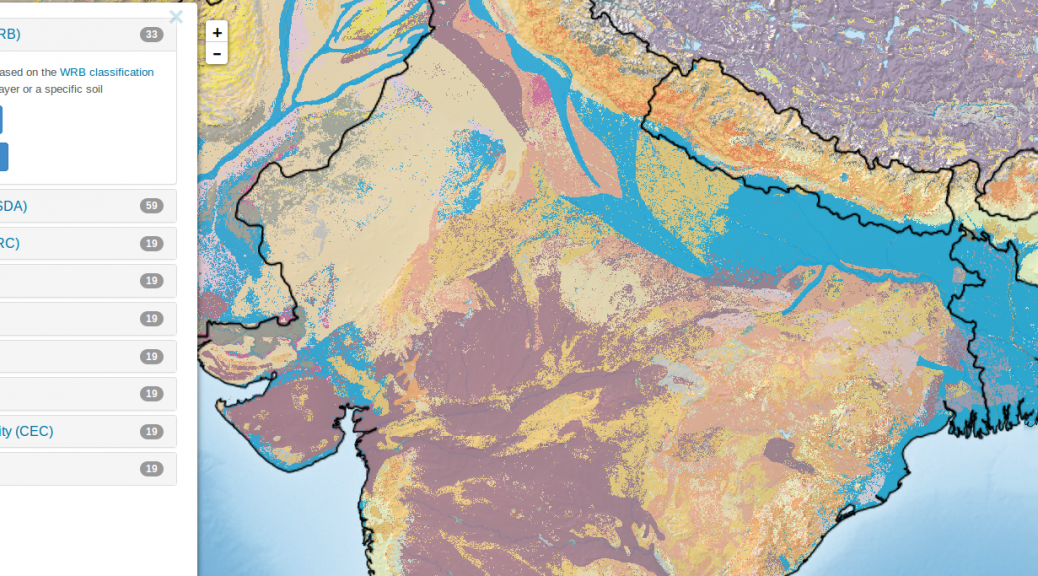
  • SoilGrids1km is a collection of updatable soil property and class maps of the world at a relatively coarse resolution of 1 km produced using state-of-the-art model-based statistical methods: 3D regression with splines for continuous soil properties and multinomial logistic regression for soil classes. SoilGrids1km is a global soil information system based on automated mapping.

Tech

Events

Mumbai Meet 3: Mapping Schools In Karnataka

Mumbai saw its third data meet on 26th October, 2014 with a total of 14 participants, in-spite of it being a Diwali weekend. This time around we decided to try out a new place and the venue was a roof top place located at Chium Village, Khar West. A nice cozy place but a tad bit difficult to find for people who are not familiar with the area.

photo (5)


This time also the crowd was titled heavily towards the tech side. 

The speaker was Sanjay Bhangar, co-founder, CAMP, who is a web developer for the past 8 years, with extensive experience in online video and mapping technologies. who first,  gave a small introduction to the Data Meet, its founders Thejs and Nisha and how it now operates as a trust and that the idea is to encourage open data movement among data enthusiasts.

Sanjay spoke on two main topics:
1. Introduction to our video archival platforms – they have been running this for the last five years.  He explained how to gather metadata about all Indian films ever made, general video analysis tools ( timeline generation / cut detection), etc.

He explained the use of , https://pad.ma  and how it is an online tool for saving videos.

IMG_20141026_184816020

2.Mapping schools in Karnataka – explained how they have been collecting data on schools in Karnataka and are working with the Akshara Foundation who run a lot of programs on schools and they have a lot of child level data which allows you to track performance of children in schools across the state.  A suggestion was made if they could also map crime data highlighting  the recent crime against children in Bangalore schools.

3.He showed us an example of how he worked on a project of mapping historical data for the New York Public Library. 

The next data meet will be held on 29th November, 2014. Pls follow the Mumbai Meet-Up Group to know about the details.

Data On the Ground: Crosspost from India Water Portal

From India Water Portal.  Communities using planning, data and collaboration to take control of their water security.  

Excerpt

What stands out in Dholavira, is the attention to detail when it came to collecting and storing water. More than 16 reservoirs are said to exist on this 100 hectare site, of which 5 have been excavated. While these reservoirs harvested rainwater, an elaborate system of drainage channels was planned to ensure that all the runoff collected in these tanks. “See this reservoir,” Raujibhai says, “it has a well inside it so that even if the tank dries up, the well will supply water”. There is also a standalone well and a seasonal stream, which was dammed at multiple points to harvest water.

Their water mantra was simple: collect and store water locally and conserve it to provide fresh water. This continues to be relevant even today for the 1.7 lakh people who live in Rapar, the taluka where Dholavira is located.

Rainfall map of India. Historically, Rapar has received poor rainfall. (Source: IWP)

Rainfall map of India. Historically, Rapar has received poor rainfall. (Source: IWP)

This has been proven by Samerth, an organisation that has worked with communities in 20 Gram Panchayats in Rapar to create structures that can store 64 million cubic feet of water. What are the elements that are common? How is Rapar’s water security now?


Read the rest of this amazing story here.

DataMeet is a community of Data Science and Open Data enthusiasts.