Written by Sanjit Oberai
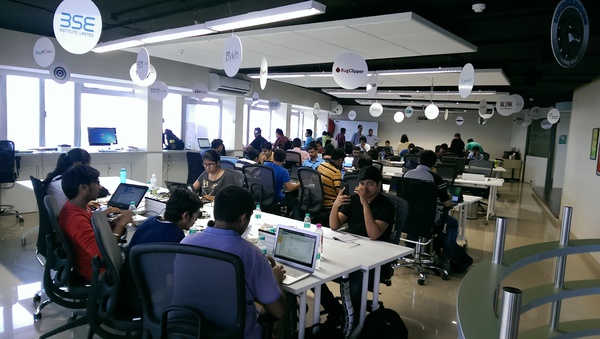
Mumbai’s first Data Meet kicked off on 30th August at the Sardar Patel Institute of Technology with a total of 26 people attending the event. It started off with a round of introduction by all the attendees which was a mix comprising developers, journalists, students and data enthusiasts.
There was an introduction by Ritvvij, who is the founder of Pykih, where he spoke about how important it is to have a data group in Mumbai. ( Listen to the recording here)
The first talk was by Ajaj Kelkar (above) , who is the Cofounder http://hansacequity.com and he gave an introduction to how the recent movement of Open Data started about 5-7 years back in the US as there was a need to move data from the private space into public space, and this was possible by the the active push seen by transparency groups. This idea spread and many progressive countries realised that this can be a powerful movement which can be used for public good.
Data can be used to help take decisions on the social or personal platforms. He highlighted that there are barriers and we need to overcome them. He explained how many cities abroad have appointed Chief Data Officers whose jobs is to monitor data in each city i.e. municipality budgets, etc.
An important point also spoken about was on Privacy. As consumers we are leaving a lot of data out there on social media platforms. However, in the absence of proper laws, we need to be careful about what we put out there and this needs to an area where we need to think carefully about.
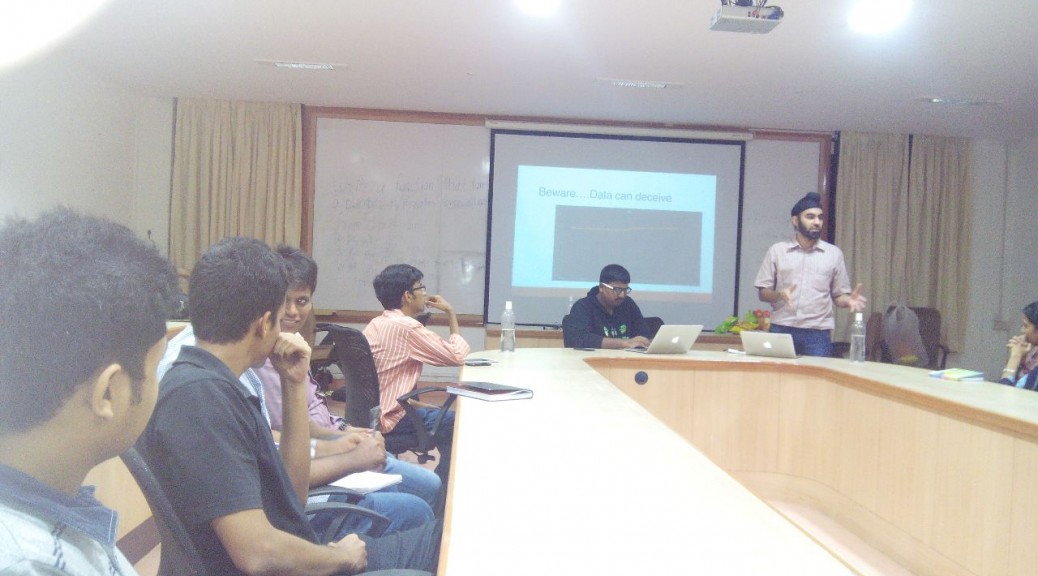
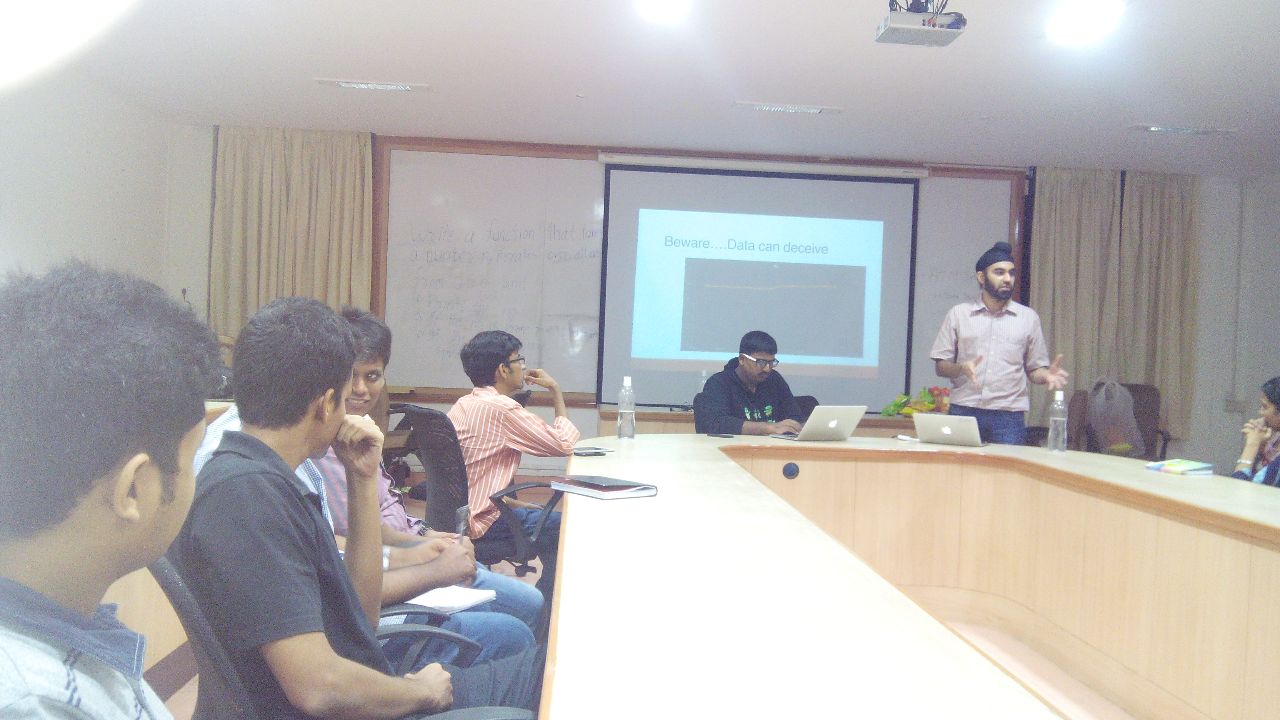
The second talk was by Ritvvij, founder of http://www.pykih.com who explained the importance of how one should visualise. He emphasised that a lot of people are not aware of how to use correct tools to visualise data and the most common mistake people make is with the humble PIE CHART. He further went onto explain the process of visualisation mistakes that many news organisations are making today and what they could do to improve their charts/graphs.
He also gave examples of his recent work with Firstpost.com where he made custom visualisations for them for the elections and the IPL. He also worked with narendramodi.in .
He also spoke about the issues most journalist face when dealing with government data and how difficult it was for them to have access to it. He ended by stating that there was a dire need for a tool that could become the CMS for data journalism there by allowing journalists to focus on the story rather than doing data janitorial work.
The third talk was by Sanjit Oberai, Deputy Editor of IndiaSpend, a non-profit that uses data to tell stories. He spoke about how there are tonnes of stories buried in government data and how to write articles around that. He spoke about how they research articles, what are the sources of data and how one can visualise data using free to use tools like Data Wrapper, Knoema, Tableau, etc.
He also spoke about a new initiative called Fact Check which can be used to bring about accountability and raise the common man’s awareness. He cited examples about the Goa MLAs who were going to Brazil and how that created quite a stir with the Congress calling this a wasteful expenditure. A quick factcheck was done to see the assets declared by them in the sworn affidavits provided by the candidates before the legislative elections in 2012.
He also spoke of a Data Room which would be a first its kind resource for students, journalists and researchers that will allow comparison of state wise data like population, health, education, etc.
The last talk was by Srinivas Kodali, an IIT-Madras graduate, who is researching with transport data of cities. He explained how one could scrap data from websites and demoed tools like Selenium for scraping from sites that generate data on the fly using AJAX. However, Selenium is a front-end tool typically used for testing and requires a browser session open. Hence, it cannot be used for large scale scrapping. Then he went on to show case PhantomJS that would allow scrapping as Selenium would but in a Headless fashion i.e. without the browser UI.
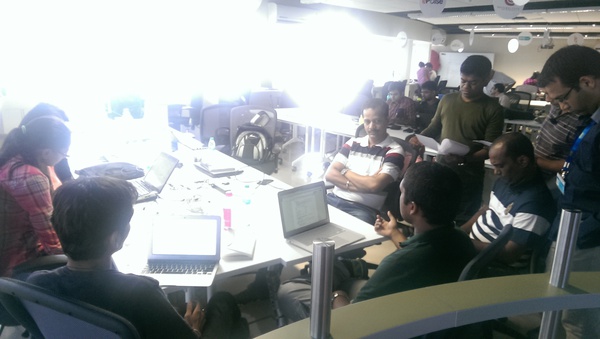
More Pics:
The next meeting with be held at the end of September. Details will be posted on the site soon.


.JPG)


.JPG)

