Category Archives: Mumbai

Mumbai Meet 7: Housing.com Talks On Analytics, Ask How India’s Story Telling Techniques

IMG_0072

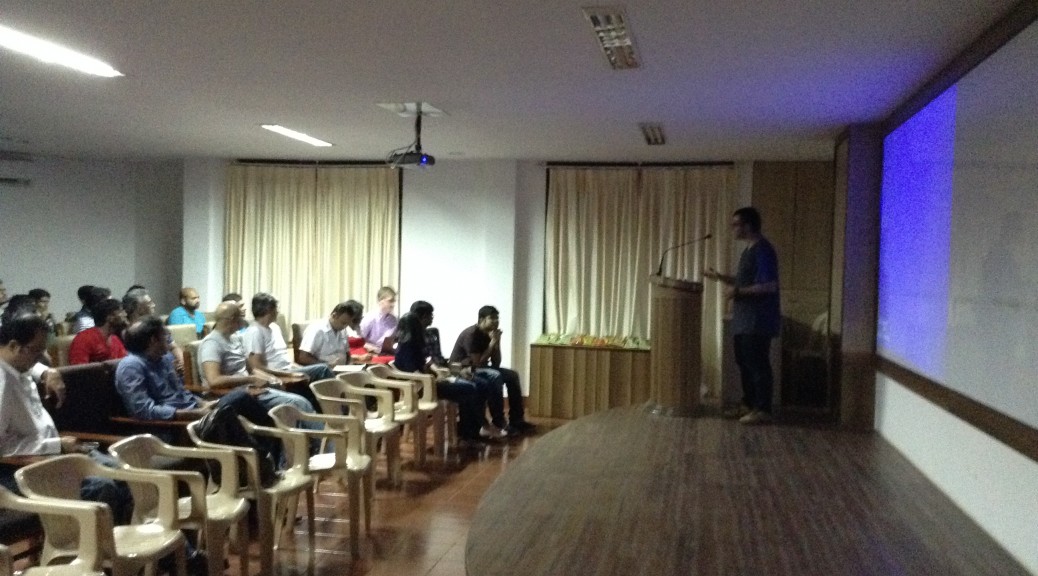
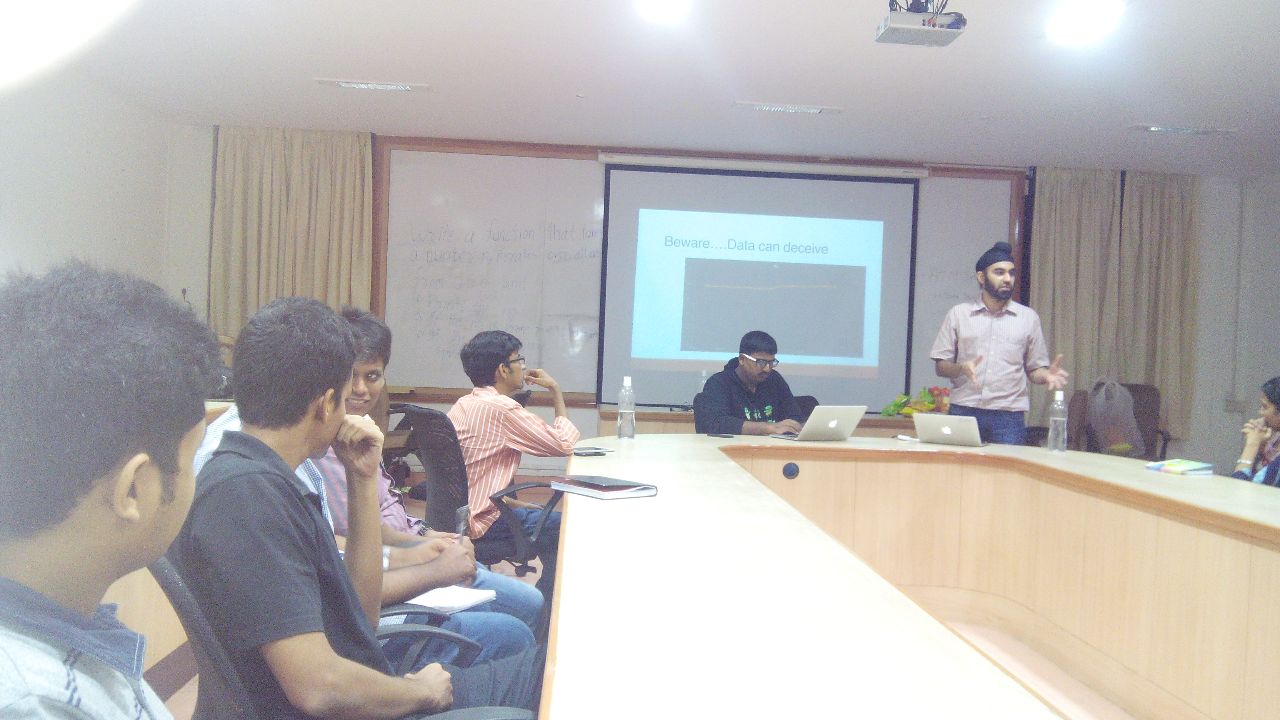
The Mumbai Data Meet kicked off the 7th session with two prominent speakers. The event was held on 30th May at the Sardar Patel Institute of Technology and was attended by more than 50+ people.

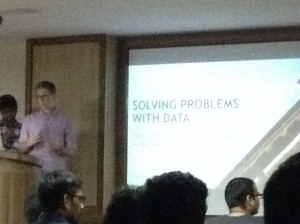
The first talk was by the team at Housing.com, which is an online real estate portal. The talk was shared between Paul Meinshausen, VP of Data Science, and Sourabh Rohilla, Data Scientist.

IMG_0080

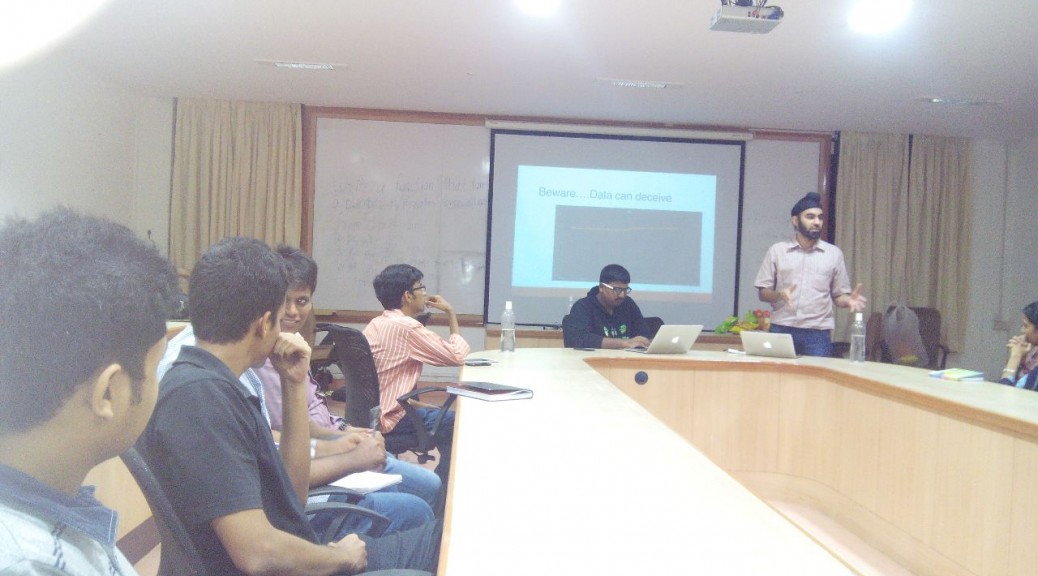
The second talk was by Yogesh Upadhyaya of AskHowIndia.org. His talk was centered around the use of data and visual story telling techniques.

IMG_0104

You can listen to the entire talk here.

And you can read more about it by Sidharth Shah over here. He has summarised the entire talk.

The next Mumbai data meet 8 will be held on 17th July.

After success of the “Data Science Hackathon” that was co-hosted with Zone Startups and a BFSI company, we are now co-organising another hackathon along with a corporate and Zone Startups.

Click here for more details.

IMG_0070

Mumbai Meet 6: Data Science Hackathon

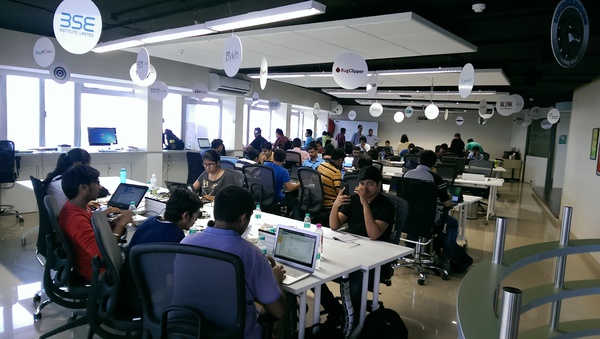
DataMeet 6 was a 2 day, Data Science Hackathon that was organised by a BFSI company, Zone Startups and DataMeet Mumbai. The Hackathon took place in the Bombay Stock Exchange Building at Zone Startup’s office. Twelve teams participated. These included teams of young data enthusiasts and specialist data scientists teams from companies like TCS and Housing.com.

The BFSI company opened up 80GB of it’s real transactional data in a secure environment to the participating data enthusiasts.

The teams were expected to analyze the data and draw out insights that would be relevant to their use case scenarios such as Health Bankruptcy or pull out a trend which is hidden and unknown to the BFSI company. Teams were free to use any tool of their choice from R, Python, Tableau, etc.

Each team was provided an individual secure Oracle DB connection from which they could query the data but not download the data. The Oracle DB connections were opened only to the Static IPs of Zone Startups Office and the data to and fro from the servers was monitored to ensure against downloading of the data.

Day 1

The day started with various teams analysing the raw data, tables, meaning of columns. The representatives from the BFSI company also gave a briefing about objectives.

600_437353359

Day 2

Many of the young teams did not turn up on Day 2 due to complexity of the problem. At the end of Day 2, the judges from the BFSI company evaluated each team’s progress, gave feedback and suggestions.

600_437353364

Mumbai Meet 4: Data Cleaning

Mumbai had it’s fourth data meet on December 6, 2014 with a total of 11 participants. Due to scheduling issues, the November meet-up was moved from last Saturday of the month to the first Saturday of December. This time the meet-up was held at Pykih’s office on 8th floor at Sardar Patel Institute Of Technology.

The speaker was Bhavin Dalal, Senior Technology Manager, from Hansa Cequity.
At Cequity, he plays multiple role not limiting to solution architect, consultant & project manager. While he has strong product framework knowledge , his expertise lies in data warehousing technologies.

Bhavin spoke on two main topics:

1. Data Cleaning – he explained what is Data Quality and which factors determine the quality of data. He briefed through the common Data quality problems faced while cleaning the data. He showed us an example where they faced problems while cleaning car data and how they solved it. He also explained data cleaning methods which will helped us to understand the approaches towards data cleaning, the importance to do data cleaning and some do’s and don’t while capturing data.

hackpad.com_xTJK5Fc0sHK_p.289611_1417935960370_IMG_20141206_184805625

2. Visualising census data for better understanding India – here he gave us eye popping fact list revolving around the census data. This topic gave us the better understanding that there are plethora of data points which can be meaningfully used to come up with really good insights on Indian population.

hackpad.com_xTJK5Fc0sHK_p.289611_1417936009366_IMG_20141206_184735045

The next data meet will be held on last Saturday of December 2014. Please follow the Mumbai Meet-Up Group to know about the details.

Mumbai Meet 3: Mapping Schools In Karnataka

Mumbai saw its third data meet on 26th October, 2014 with a total of 14 participants, in-spite of it being a Diwali weekend. This time around we decided to try out a new place and the venue was a roof top place located at Chium Village, Khar West. A nice cozy place but a tad bit difficult to find for people who are not familiar with the area.

photo (5)


This time also the crowd was titled heavily towards the tech side. 

The speaker was Sanjay Bhangar, co-founder, CAMP, who is a web developer for the past 8 years, with extensive experience in online video and mapping technologies. who first,  gave a small introduction to the Data Meet, its founders Thejs and Nisha and how it now operates as a trust and that the idea is to encourage open data movement among data enthusiasts.

Sanjay spoke on two main topics:
1. Introduction to our video archival platforms – they have been running this for the last five years.  He explained how to gather metadata about all Indian films ever made, general video analysis tools ( timeline generation / cut detection), etc.

He explained the use of , https://pad.ma  and how it is an online tool for saving videos.

IMG_20141026_184816020

2.Mapping schools in Karnataka – explained how they have been collecting data on schools in Karnataka and are working with the Akshara Foundation who run a lot of programs on schools and they have a lot of child level data which allows you to track performance of children in schools across the state.  A suggestion was made if they could also map crime data highlighting  the recent crime against children in Bangalore schools.

3.He showed us an example of how he worked on a project of mapping historical data for the New York Public Library. 

The next data meet will be held on 29th November, 2014. Pls follow the Mumbai Meet-Up Group to know about the details.

Mumbai’s Data Meet Kicks Off With A Bang

Written by Sanjit Oberai
Mumbai’s first Data Meet kicked off on 30th August at the Sardar Patel Institute of Technology with a total of  26 people attending the event.  It started off with a round of introduction by all the attendees which was a mix comprising developers, journalists, students and data enthusiasts. 
There was an introduction by Ritvvij, who is the founder of Pykih, where he spoke about how important it is to have a data group in Mumbai. ( Listen to the recording here
The first talk was by Ajaj Kelkar (above) , who is the  Cofounder http://hansacequity.com  and he gave an introduction to how the recent movement of Open Data started about 5-7 years back in the US as there was  a need to move data from the private space into public space, and this was possible by the the active push seen by transparency groups.  This idea spread and many progressive countries realised that this can be a powerful movement which can be used for public good.   
Data can be used to help take decisions on the social or personal platforms. He highlighted that there are barriers and we need to overcome them.  He explained how many cities abroad have appointed Chief Data Officers whose jobs is to monitor data in each city i.e. municipality budgets, etc. 
An important point also spoken about was on Privacy.  As consumers we are leaving a lot of data out there on social media platforms. However, in the absence of proper laws, we need to be careful about what we put out there and this needs to an area where we need to think carefully about.
The second talk was by Ritvvij, founder of http://www.pykih.com who explained the importance of how one should visualise. He emphasised that a lot of people are not aware of how to use correct tools to visualise data and the most common mistake people make is with the humble PIE CHART. He further went onto explain the process of visualisation mistakes that many news organisations are making today and what they could do to improve their charts/graphs
He also gave examples of his recent work with Firstpost.com where he made custom visualisations for them for the elections and the IPL.  He also worked with narendramodi.in . 
He also spoke about the issues most journalist face when dealing with government data and how difficult it was for them to have access to it.  He ended by stating that there was a dire need for a tool that could become the CMS for data journalism there by allowing journalists to focus on the story rather than doing data janitorial work. 
 
 
The third talk was by Sanjit Oberai, Deputy Editor of IndiaSpend, a non-profit that uses data to tell stories. He spoke about how there are tonnes of stories buried in government data and how to write articles around that. He spoke about how they research articles, what are the sources of data and how one can visualise data using free to use tools like Data Wrapper, Knoema, Tableau, etc.
 He also spoke about a new initiative called Fact Check which can be used to bring about accountability and raise the common man’s awareness. He cited examples about the Goa MLAs who were going to Brazil and how that created quite a stir with the Congress calling this a wasteful expenditure.  A quick factcheck was done to see the assets declared by them in the sworn affidavits provided by the candidates before the legislative elections in 2012.
 
 He also spoke of a Data Room which would be a first its kind resource for students, journalists and researchers that will allow comparison of state wise data like population, health, education, etc.
The last talk was by Srinivas Kodali, an IIT-Madras graduate, who is researching with transport data of cities. He explained how one could scrap data from websites and demoed tools like Selenium for scraping from sites that generate data on the fly using AJAX. However, Selenium is a front-end tool typically used for testing and requires a browser session open. Hence, it cannot be used for large scale scrapping. Then he went on to show case PhantomJS that would allow scrapping  as Selenium would but in a Headless fashion i.e. without the browser UI.
More Pics:
The next meeting with be held at the end of September. Details will be posted on the site soon.