DataMeet has always been interested in doing projects so last year we decided to run a pilot. In the last few years the demand for data work has increased from non profits and journalists and they usually approach data analytics vendors like Gramener. However, these firms can be expensive or have high paying clientele which means that smaller accounts tend to not get their full attention. This leads to an increase in volunteer events like hackathons which don’t always result in finished usable products or can give non profits the long term engagement they need to solve issues. Vendors are not usually privy to the specific data problems a sector has and don’t want to let their tech people invest the time to learn about the subject and understand the particular data challenges. Though the civic tech space is growing, non profits and media houses can’t yet afford or see the need for internal tech teams to deal with their data workload.
With all this in mind we wanted to see if DataMeet can help fill and enrich this space as well as help build capacity within non profits to manage data projects. We were trying to find out, can we assemble teams through the DataMeet network to manage the entire pipeline of data work from clean up to visualization. These wouldn’t be permanent teams but filled with freelancers or hobbyists.
For this first project DataMeet would project manage and Gramener would provde the data analysts, the non profit managing partner was Arghyam and the ground partner was Megh Pyne Abhiyan. Megh Pyne Abhiyan works in several districts in north Bihar on water and sanitation issues. They wanted to use data to tell the story of what the status of water and sanitation was in those districts as a way of engaging with people during the election. It was decided we would do water and sanitation (WATSAN) status report cards for 5 districts — Khagaria, Pashchim Champaran, Madhubani, Saharasa, and Supaul — using government data.
This was an exciting project for us because it would be the first time DataMeet would work with a partner who works on the ground and the output would be for a rural, non online, non-English speaking audience.
DataMeet would project manage the process of data cleanup, analysis and visualization (which the team from Gramener would do) and then give the report cards to the Megh Pyne Abhiyan for them to do the translation and create the final representation of the report cards for their audience.
The Data
The partner wanted the data to be mapped to Assembly Constituencies, they wanted analysis for following situations
- Sanitation coverage for each Assembly Constituency and Gram Panchayat.
- Water quality, what is the contamination situation of the district, Assembly Constituency and Gram Panchayat.
- Water access, how do people get their drinking water.
It was also important to understand this data in the context of the flood prone areas of Bihar. For instance if there is an area that gets drinking water from shallow wells, with little sanitation in a high flood area those areas can suffer from high levels of water borne diseases.
The data we got was from
- Ministry of Drinking Water and Sanitation’s (MDWS) two major schemes, Swatcch Bharat Mission and National Rural Piped Water Supply Scheme.
- Flood maps from Bihar State Disaster Management Authority
- Assembly Constituency files from DataMeet’s open shapefiles obtained from ODC BLR 2014
Since we were doing report cards based on Assembly Constituencies we needed the data to be at the Gram Panchayat (GP) level. Luckily the MDWS does a good job of collecting data all the way down to habitation so GP level data was available.
There is no official listing of what GPs are in which Assembly Constituency so the partner was asked to split the data by AC so we wouldn’t have to do that mapping. They agreed they knew the area better and would have the resources to pull together all the GP level data into organized Dropbox folders grouped by districts then split into ACs.
Data Cleanup
We received one PDF file per GP, for water access and number of toilets, water quality was given in one large file by district.
All the data we received was in PDF. This was a huge hurdle as the data was from the government information management system so it was from a digital format but rendered in a PDF this meant that we had to convert unnecessarily. However, since the ground partner picked the data they needed and organized it by AC we wanted to make sure we were using the data they specified as important. So we decided to convert the data. This job was done by Thej and I and was extremely manual and time consuming and caused some delay in the data being sent to the analysts. (See how we did it here.)
Analysis
The analysis required was basic. They needed to know at an AC level what the sanitation coverage was, the sources of water, how people were accessing it and what the water quality situation is. Rankings compared to other districts and ACs were done to give context. Rankings compared to other districts and ACs were done to give context.So in all the analysis stage didn’t take much time.
Example of Analysis
Visualization
The UNDP along with the Bihar State Disaster Management Authority had created a map of diaster prone areas including flood. It was in PDF so we asked the folks at Mapbox India to help out with creating a shapefile for the flood map so we layer flood areas onto the Assembly Constituencies.
Bihar AC map with flood prone areas
While we had AC maps we didn’t have GP level maps. They didn’t seem to be available and we couldn’t find them in PDF form either.
Since the election is staggered by district we started with Khagaria. After the initial report cards were done the partner wanted just the cleaned up data in tables to use for their meetings. So we then decided to do the report cards, clean up the data and send the spreadsheets over to them.
As we were processing the next 4 districts I found GP level maps of Bihar, with boundaries of ACs included. This was quite exciting and I thought since we had some time we could do maps for the four pending districts.
After receiving the analysis for the next district I decided that since it would take to long to trace the PDF maps, so the analysts could map the GPs, I would just over lay them onto our AC shapefiles in Photoshop. I was going to put icons or circles in the center of the GP and that would be the map. While tedious I figured it would be worth it to show the maps to the ground partner.
However, when I started mapping I realized that analyzed data wasn’t matching up with the GPs on the map. The GPs listed in the Assembly Constituency in our original folders were incorrect, which meant all the analysis was wrong. Everything had to be checked against the maps and reorganized in the final datasets and then reanalyzed. This caused a huge delay.
On top of that the GPs on the map were spelled differently than in the MDWS data, and every dataset potentially had a different spelling of a particular GP. Which meant the remapping of the data had to be done manually looking at the map, the data, other sources, and sometimes guessing if this was the correct GP or not. This ended up being a manual process for every AC, as we didn’t do this mapping and standardization in the beginning.
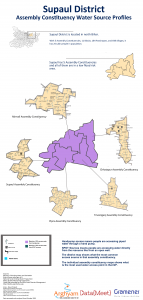
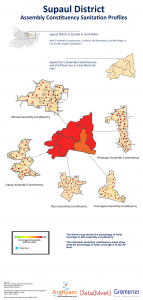
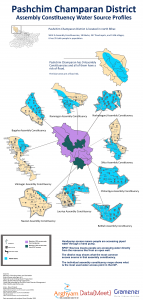
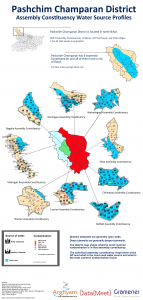
While the delay caused problems with the maps being used in the election, they were worth doing to understand the problems with the data and the ground partner identified with the maps the most. By the end we were able to produced districts posters for the different parameters.
Sample report card
Final Posters
Lessons for next time
We learned a lot from this process. Mainly that the issues with standardization of Indian names in data is a real concern. While initiatives like Data.Gov.In are an important first step, it will take real will and dedication to work out this problem.
NGOs and groups that don’t work with data at the scale of modern data techniques are not always familiar with issues like formats, standardization problems, data interoperability,visualization and mapping to other datasets. This means that more time needs to be spent getting the intentions of the project out of the partner not just outputs. Problems like PDFs are not things everyone thinks about so the extra time of working with the partner to understand what data they want and find way to get it are better spent then converting PDFs to CSV if we don’t have to.
Designers are important, I created and designed the maps and posters, while I’m proud of them, they could have been done better and faster by a trained designer. Designers are worth the money and effort in order to make the final product really reflect the care and work we put into the data.
I consider this experience a success, despite the setbacks, we learned how to manage a team that was not full time and how important the initial work with the ground partners are to create realistic deliverables and timelines.
You can get all the data on DataMeet’s github page.
Big thanks to the Gramener team – Santhosh, Pratap and Girish for dedicating their free time to this.
