This has been crossposted from Thej GN’s blog.
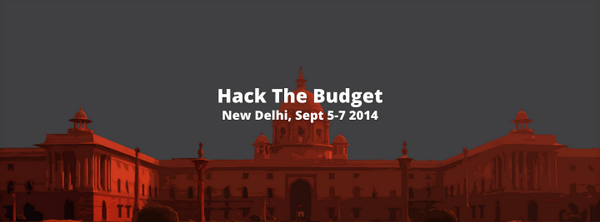
“First ever DataBootCamp in India was organized by ICFJ in collabaration with Data{Meet}, HT, Hacks/Hackers – New Delhi, 9.9 School of Journalism in Delhi. It was a three-day event hosted by Bridge School of Management. It was an interesting gathering as more than 50% were from journalistic background. I have never seen such a big group of journalists in one place for three days, working in groups with people of different backgrounds.
Major part of the camp was to propose projects/stories and work on them. Group selected ten projects out of all the proposed projects. I have listed the projects below, hyperlinking to end results. If you like to see all the proposed projects then go to HackDash.

- Narendra Modi On Twitter Vs Other Global Leaders – Word Play vs Ground Reality
- Crime Agaisnt Women In India
- Class Calculator – Think you’re in the middle class? Use the class calculator. Scroll down to find out. You may be surprised. Or Not.
- Cashless In India – Is India becoming a #cashlesseconomy?
- Terror Statistics
- Money poured into Ganga vs pollution levels
- India’s Supreme Court Ruling on Under-Trial Prisoners
- Media Ownership
- Advertising For Online Video To Rise By 30%
- Build Hospitals To Kill Cancer
Of course we had hands-on workshops on scraping, data cleaning, data visualization and mapping. I will probably need a series of posts to cover them all here. I have put the relevant links at the bottom for you to explore. Best part was some of the participants used the tools they learnt during the camp for their project work.
Other Interesting facts/links/tools that i came across during the event:
- Delhi Ward Level Maps
- CartoDB
- Table2Clipboard firefox addon
- Download Them All Firefox addon
- IMacros Firefox addon
- OpenRefine – A free, open source, powerful tool for working with messy data
- Rumi – Collaboration around data and visualizations projects
- DataWrapper – An open source tool helping anyone to create simple, correct and embeddable charts in minutes.
- Google Fusion Tables is an experimental data visualization web application to gather, visualize, and share data tables.
- We are Angry is an effort to keep the conversation that started after upsettingly brutal December 16, 2012 gang-rape in New Delhi alive.
Overall I was surprised at the quality of the projects. At least half of them were executed very well. Two days are actually very small amount of time, so hats off to all the participants. As a participant and duct-tape programmer/trainer I had lots of fun. I hope there will be more collaborations between tech and journalism community in future.”
See Thej’s post for more pictures. Also if you were at the event and have a post please let us know!

One thought on “Notes from first Data BootCamp India”
Comments are closed.