Category Archives: Uncategorized

DataMeet Story: S Anand

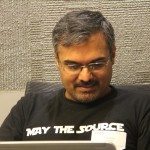
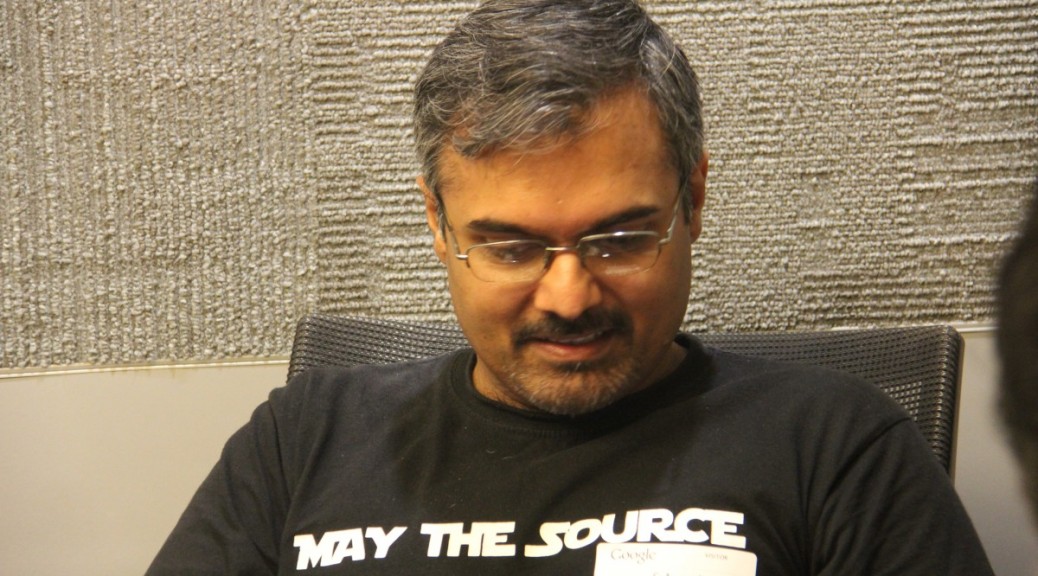
DataMeet was started on January 26th 2011 by a handful of data enthusiasts. One of them was Anand S, also a Trustee of DataMeet Trust, he is currently one of the founders of Gramener.

In 2011, Anand was working at Infosys in London.  He and a few friends, that he had gone to school with or worked with, were talking about starting a group where people can share tips for working with data. The intent was always to work on data in India and to find others doing the same. Since there were many data groups in London I felt there should be one for India.

The first few members were Thej, Naveen, Bala and Manu, they were all working with data in some capacity either professional or personal. Naveen had just started Gramener a data analytics firm, Bala and Manu had started Report Bee, on data analysis for education,  Thej was working at Janaagraha and Infosys on data projects. They all shared a passion for sharing and open data, and other open source technologies.

They called it DataMeet becauseit was available then invited people they knew to join the list and had Skype calls about sharing data science tips. You can see the minutes from the first meeting here: https://docs.google.com/document/pub?id=1LXm5OwQiS4xzbcqfTrF6rBzZ76aGrwvKFYD36RPYS2c And a video was taken of Anand S showing people an Excel tip.

Anand adds that he never expected it to reach beyond 100 and that the group is of great value to him because of all the data and ideas that are being shared. When asked what he thinks DataMeet will do in the future he hopes the group doesn’t change too much and that “everyone continues adding their own knowledge and working toward opening up and sharing data.” Anything else? Anand doesn’t want to speculate. We’ll see!

Presenting the DataMeet Official Logo!

DataMeet needed a logo so we asked the group if they could provide some ideas.   We thought we would get 1 or 2 ideas but we ended up with 15 great design ideas!

Not knowing how to pick we decided to ask the group to vote. You can see all the potential designs here.  The voting ended on May 20th and after a few tweaks to the design.  The winner is:

cropped-datameet_logo_v.1.2.png


and a short icon here:

datameet_icon_v.1.1


Thank you to Sumandro for designing this amazing logo for us!

Credit the following icon from the Noun Project as part of the logo.  You can get the files here.

Thank you to everyone who contributed designs and to all who voted!


Mention on Hindu Data Blog!

Thanks to Rukmini from the Hindu Data Blog!

One bright spark in all this gloom has been India’s growing Open Data community. Srinivas Ramani, Senior Assistant Editor at the Economic and Political Weekly, put out this fantastic compilation of constituency-wise turnout figures, also neatly visualised as an India map, on Twitter yesterday (he is@vrsrini). Srinivas says that many state CEOs were helpful, but he also benefitted from the generosity of journalists like Anil Padmanabhan, Deputy Managing Editor at Mint (@capitalcalculus) and the open data community on a Google Group called Datameet which helped him create shape files to fit the numbers to the map. Lastly, Srinivas, like other members of the community put the results of their hard work into the public domain for others to play with, without getting proprietary and possessive about it, something that I as a journalist have still to fully learn.

Read the rest over at The Hindu Blog here.


Georeferencing 101 – Breaking down the electoral map – dot by dot

In preparation for Bangalore Open Data Camp 2014: Election special.  We did two small workshops one on working with PDFs and the other on learning Georeferencing and Vectorising basics. We did these two workshops because so much of working with election data is parsing PDFs and trying to get shapefiles.

20140315_133437

Indian MP/MLA Constituency shapes are created and maintained by the Election Commission. There is a great wealth of information on this site, and if you can go to the state sites to see even more local electoral information for Parliament and Assembly constituencies.  However, these maps they give you are in PDF, if you want to create visualizations, layer data, or get any in depth understanding of your constituency these PDF maps make it difficult.

Sajjad Anwar headed our Georeferencing 101 workshop.  He went through the basics of using QGIS the open source GIS software.

QGIS is a great free open source resource for creating, visualising and, editing spatial data of various formats. Like any editor you have to become accustomed to the layout and the terminology which can be hard for beginners.  It might be overwhelming when you first start but just take a deep breath.  There is a great intro guide here and tons of Youtube guides.

To start looking at georeferencing data:

Things you need:

  1. Download qgis 2.0 or above.
  2. Need a picture, any format jpg, png etc.
  3. Base Reference file preferably a vector file.

If you can’t determine the border needs enhancing clean it up with GIMP, Inscape or any of your favourite graphic editor, and use the Georeferencer plugin – set the ground control points

Where you can get some reference files

  1. Global administrative boundary website 
  2. Open street maps –not the best but available

If you can’t find the reference file you might need.  The best you can get is the taluk level, if you can get that you can reference constituencies but district level is also acceptable it is the easiest boundary you can reference.   Don’t use Google  it is a violation of their terms of service

When you have your picture and reference vector file you can then use QGIS to outline the picture by creating points.  You put a point on the picture then pick the corresponding point on the map.https://pbs.twimg.com/media/BiwxmhFCQAATnML.png:large

This assigns lat/longs to your picture and creates the references for the polygon to be created.  After this then you can add layers of data and create your map visualization!

Any georeferencing you do is a derivative work, so just keep in mind the license of the base layer.

You can learn more about the challenges of creating MP/MLA constituency maps on the DataMeet Google Group here.

We will be doing more of these workshops in the future so check back here for more information.