Category Archives: Uncategorized

Bihar Elections

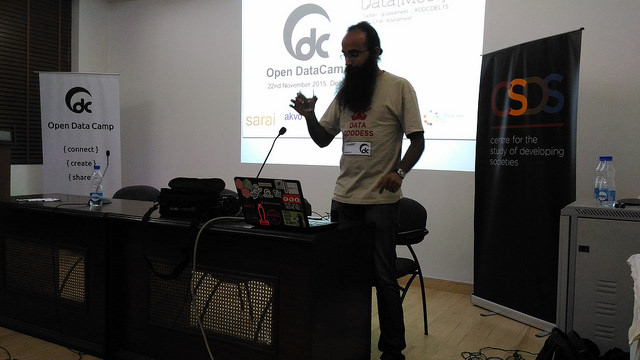
DataMeet has always been interested in doing projects so last year we decided to run a pilot. In the last few years the demand for data work has increased from non profits and journalists and they usually approach data analytics vendors like Gramener. However, these firms can be expensive or have high paying clientele which means that smaller accounts tend to not get their full attention. This leads to an increase in volunteer events like hackathons which don’t always result in finished usable products or can give non profits the long term engagement they need to solve issues. Vendors are not usually privy to the specific data problems a sector has and don’t want to let their tech people invest the time to learn about the subject and understand the particular data challenges. Though the civic tech space is growing, non profits and media houses can’t yet afford or see the need for internal tech teams to deal with their data workload.

With all this in mind we wanted to see if DataMeet can help fill and enrich this space as well as help build capacity within non profits to manage data projects. We were trying to find out, can we assemble teams through the DataMeet network to manage the entire pipeline of data work from clean up to visualization. These wouldn’t be permanent teams but filled with freelancers or hobbyists.

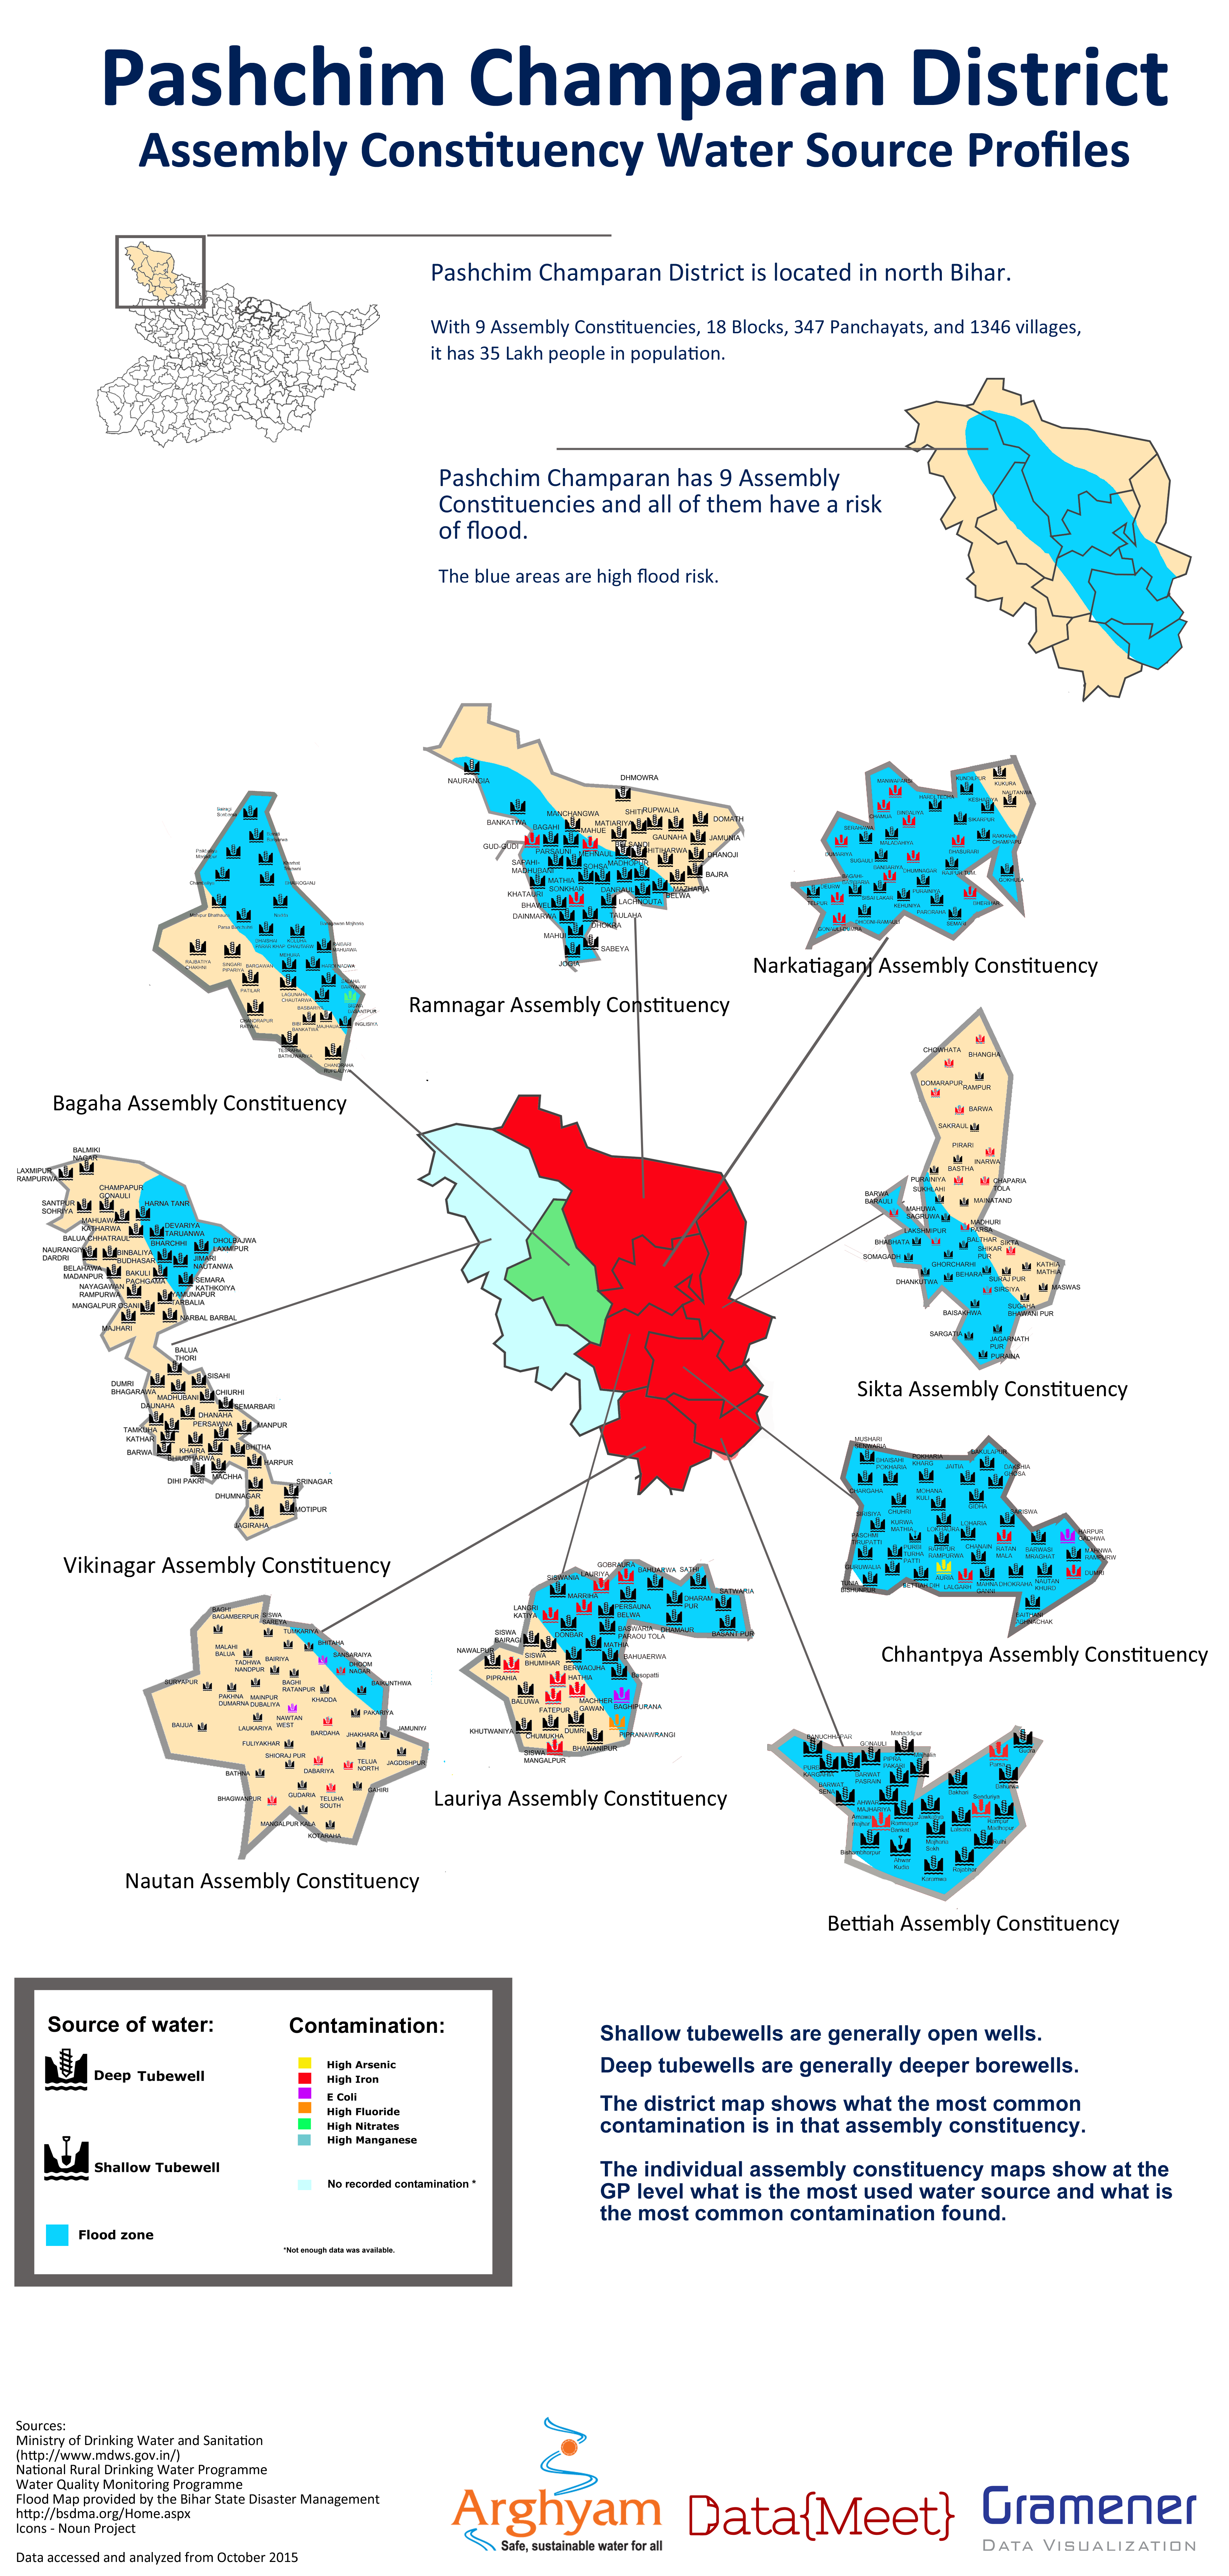
For this first project DataMeet would project manage and Gramener would provde the data analysts, the non profit managing partner was Arghyam and the ground partner was Megh Pyne Abhiyan. Megh Pyne Abhiyan works in several districts in north Bihar on water and sanitation issues. They wanted to use data to tell the story of what the status of water and sanitation was in those districts as a way of engaging with people during the election. It was decided we would do water and sanitation (WATSAN) status report cards for 5 districts — Khagaria, Pashchim Champaran, Madhubani, Saharasa, and Supaul — using government data.

This was an exciting project for us because it would be the first time DataMeet would work with a partner who works on the ground and the output would be for a rural, non online, non-English speaking audience.

DataMeet would project manage the process of data cleanup, analysis and visualization (which the team from Gramener would do) and then give the report cards to the Megh Pyne Abhiyan for them to do the translation and create the final representation of the report cards for their audience.

The Data

The partner wanted the data to be mapped to Assembly Constituencies, they wanted analysis for following situations

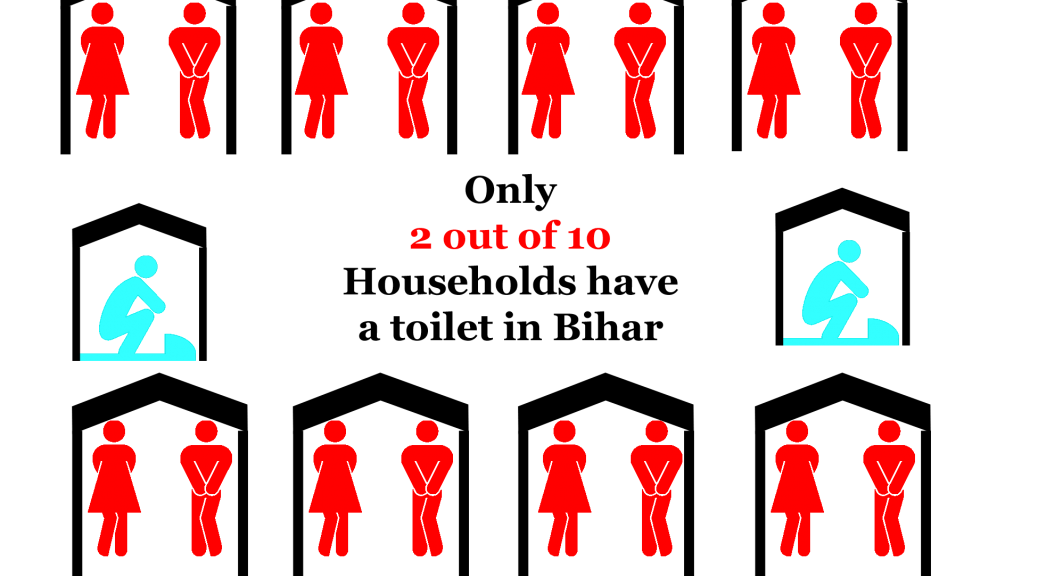
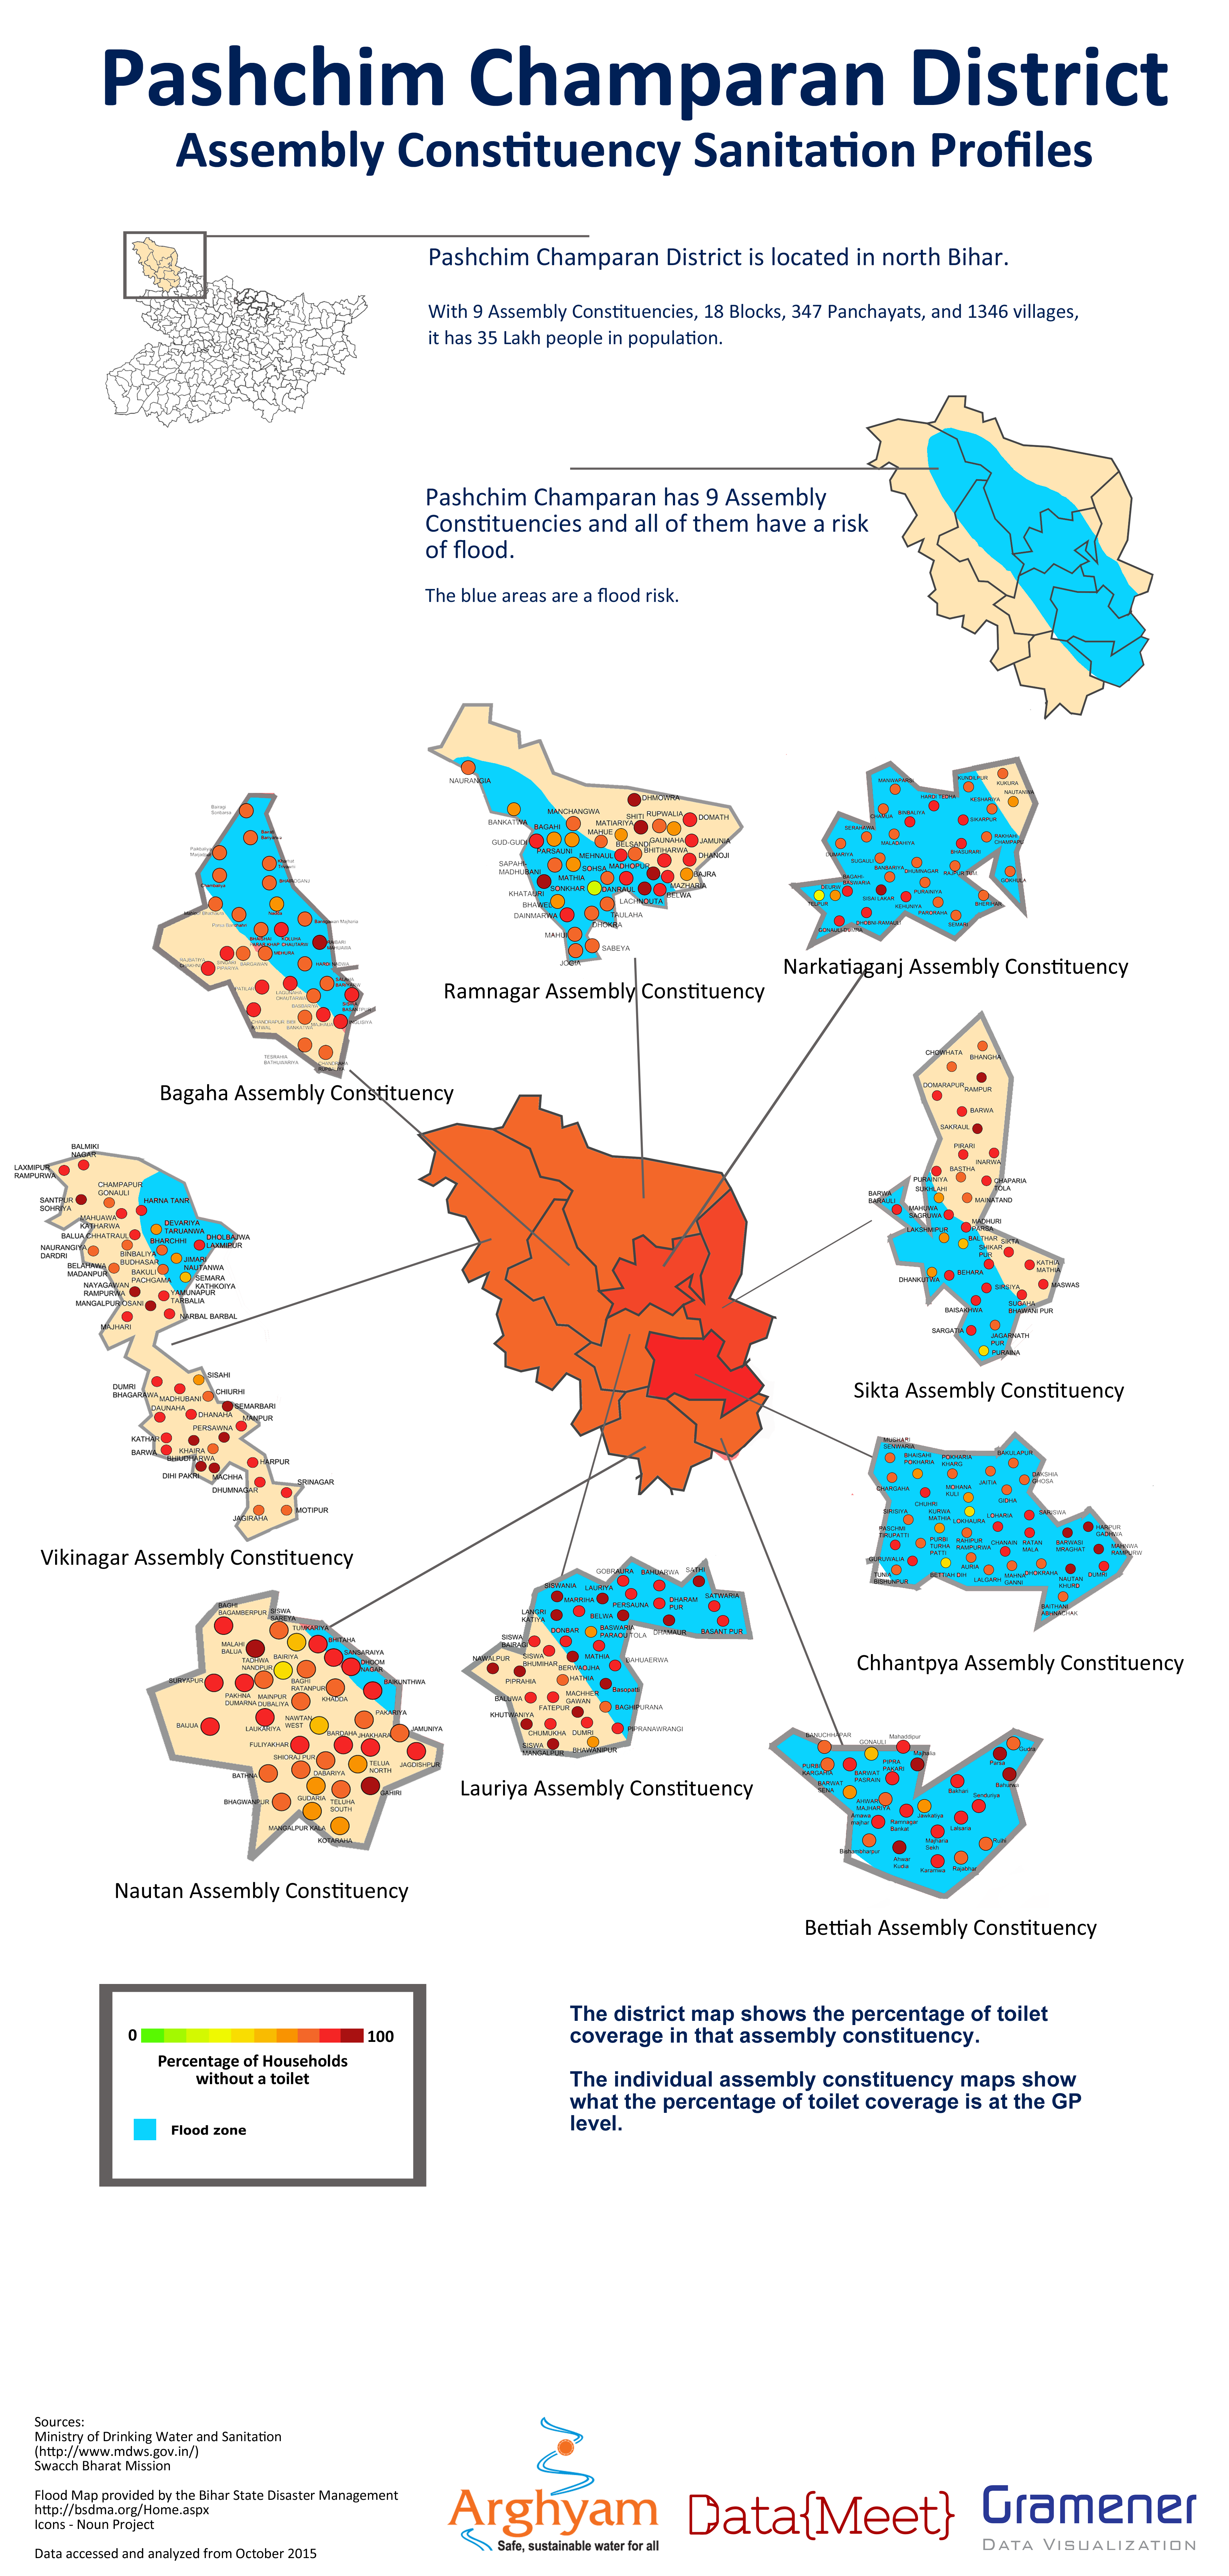
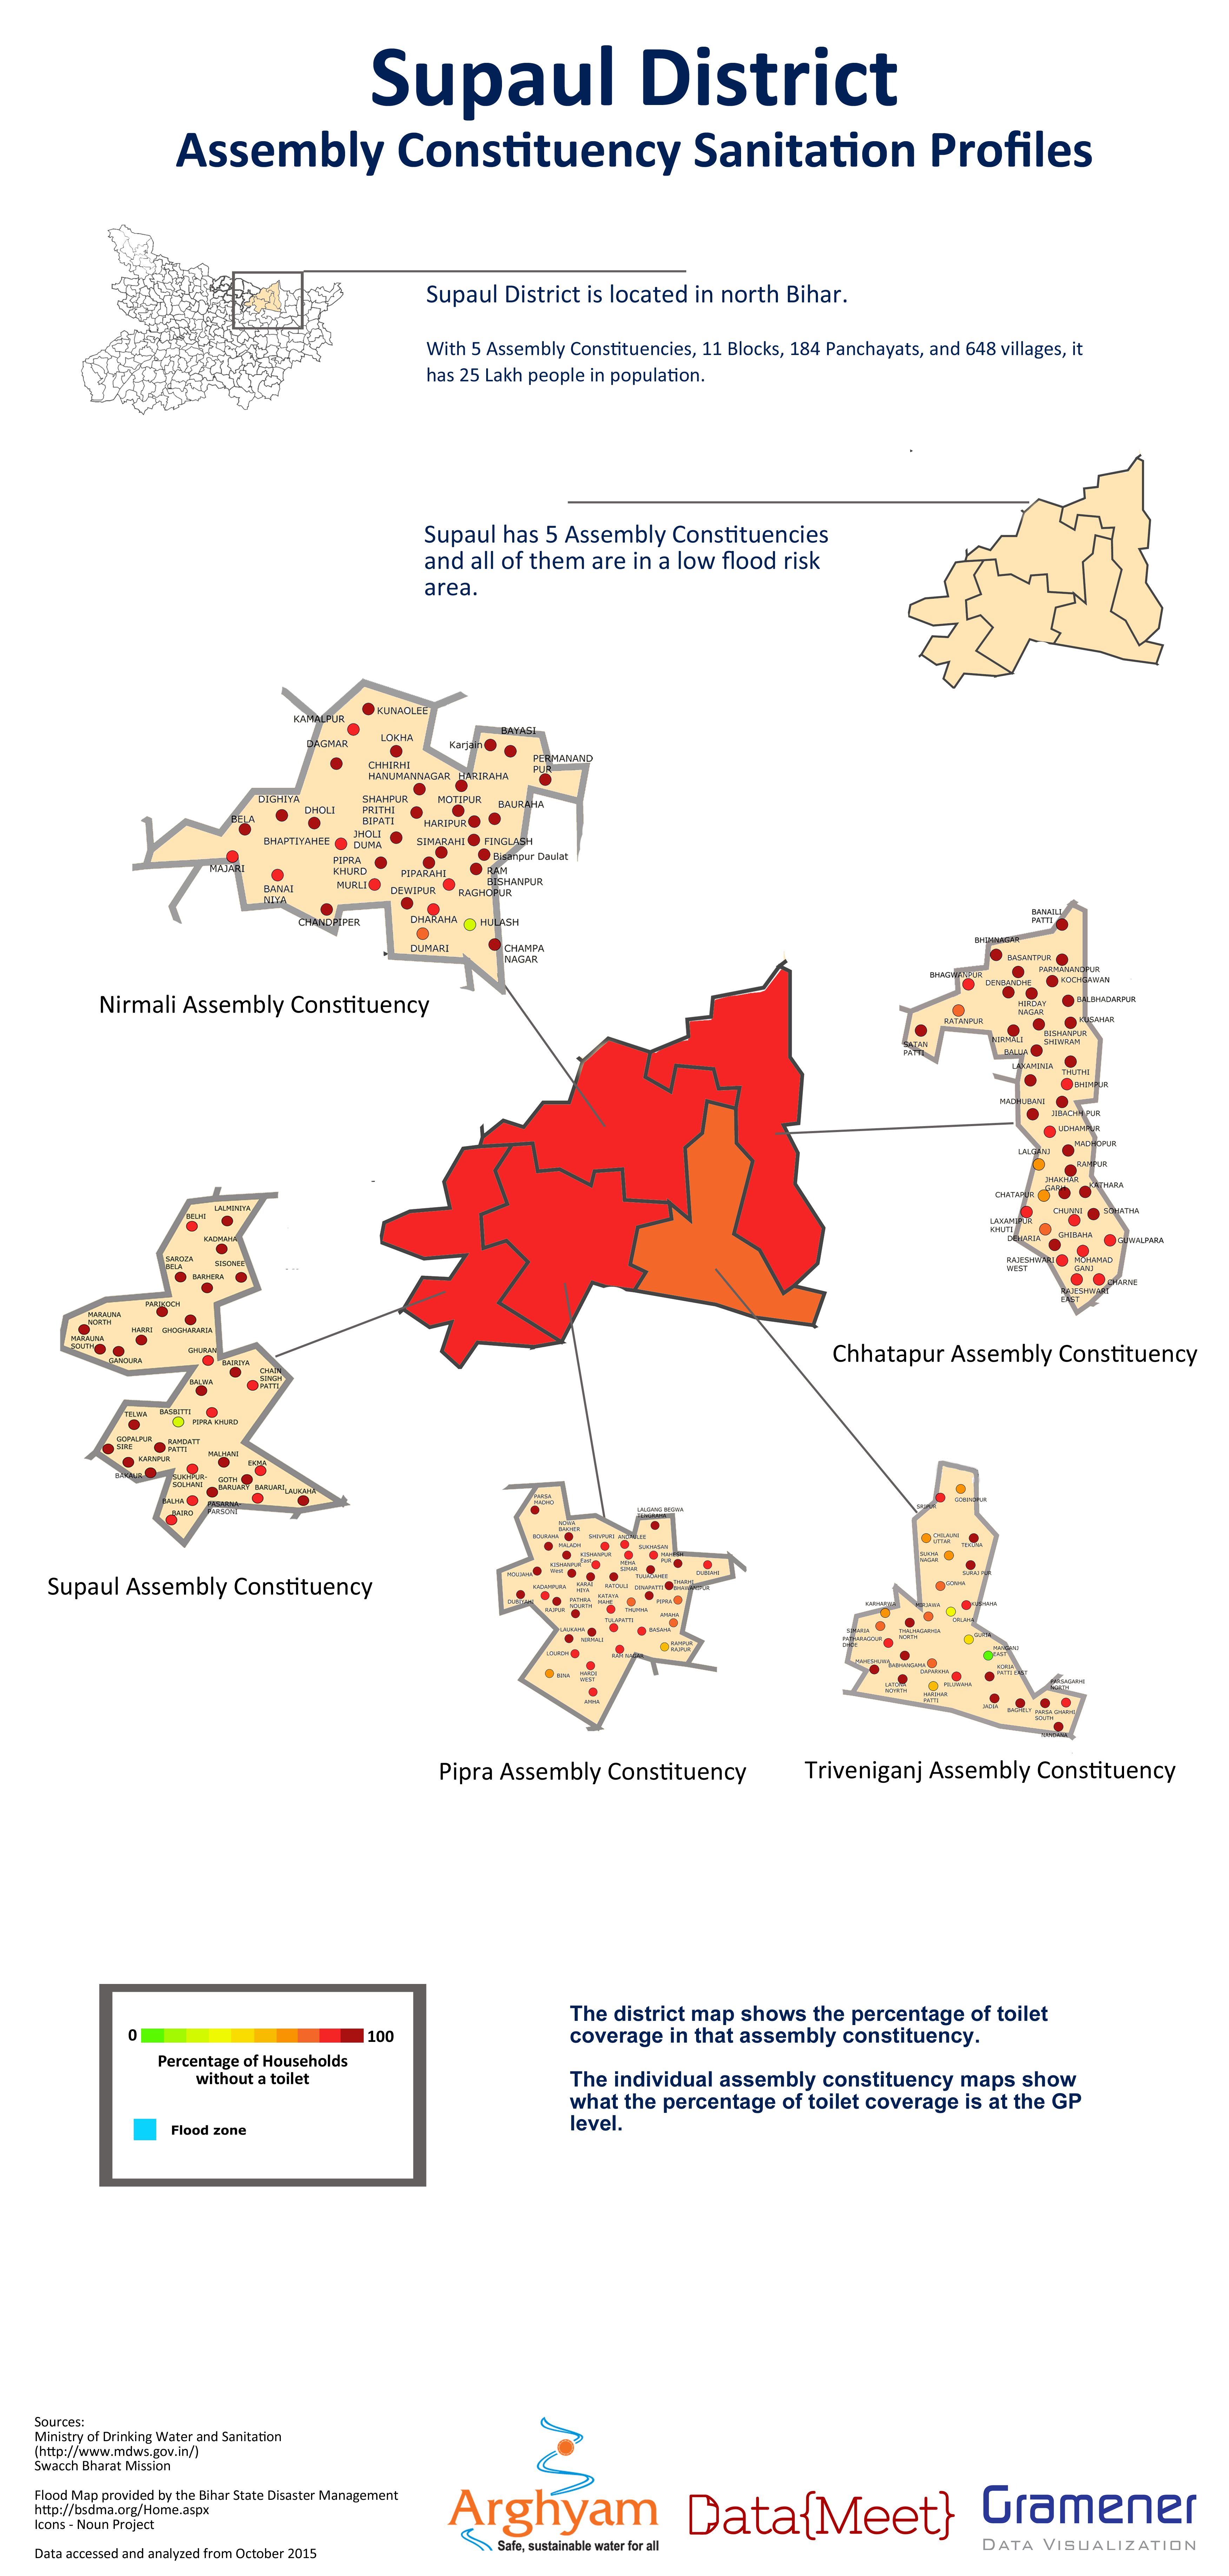
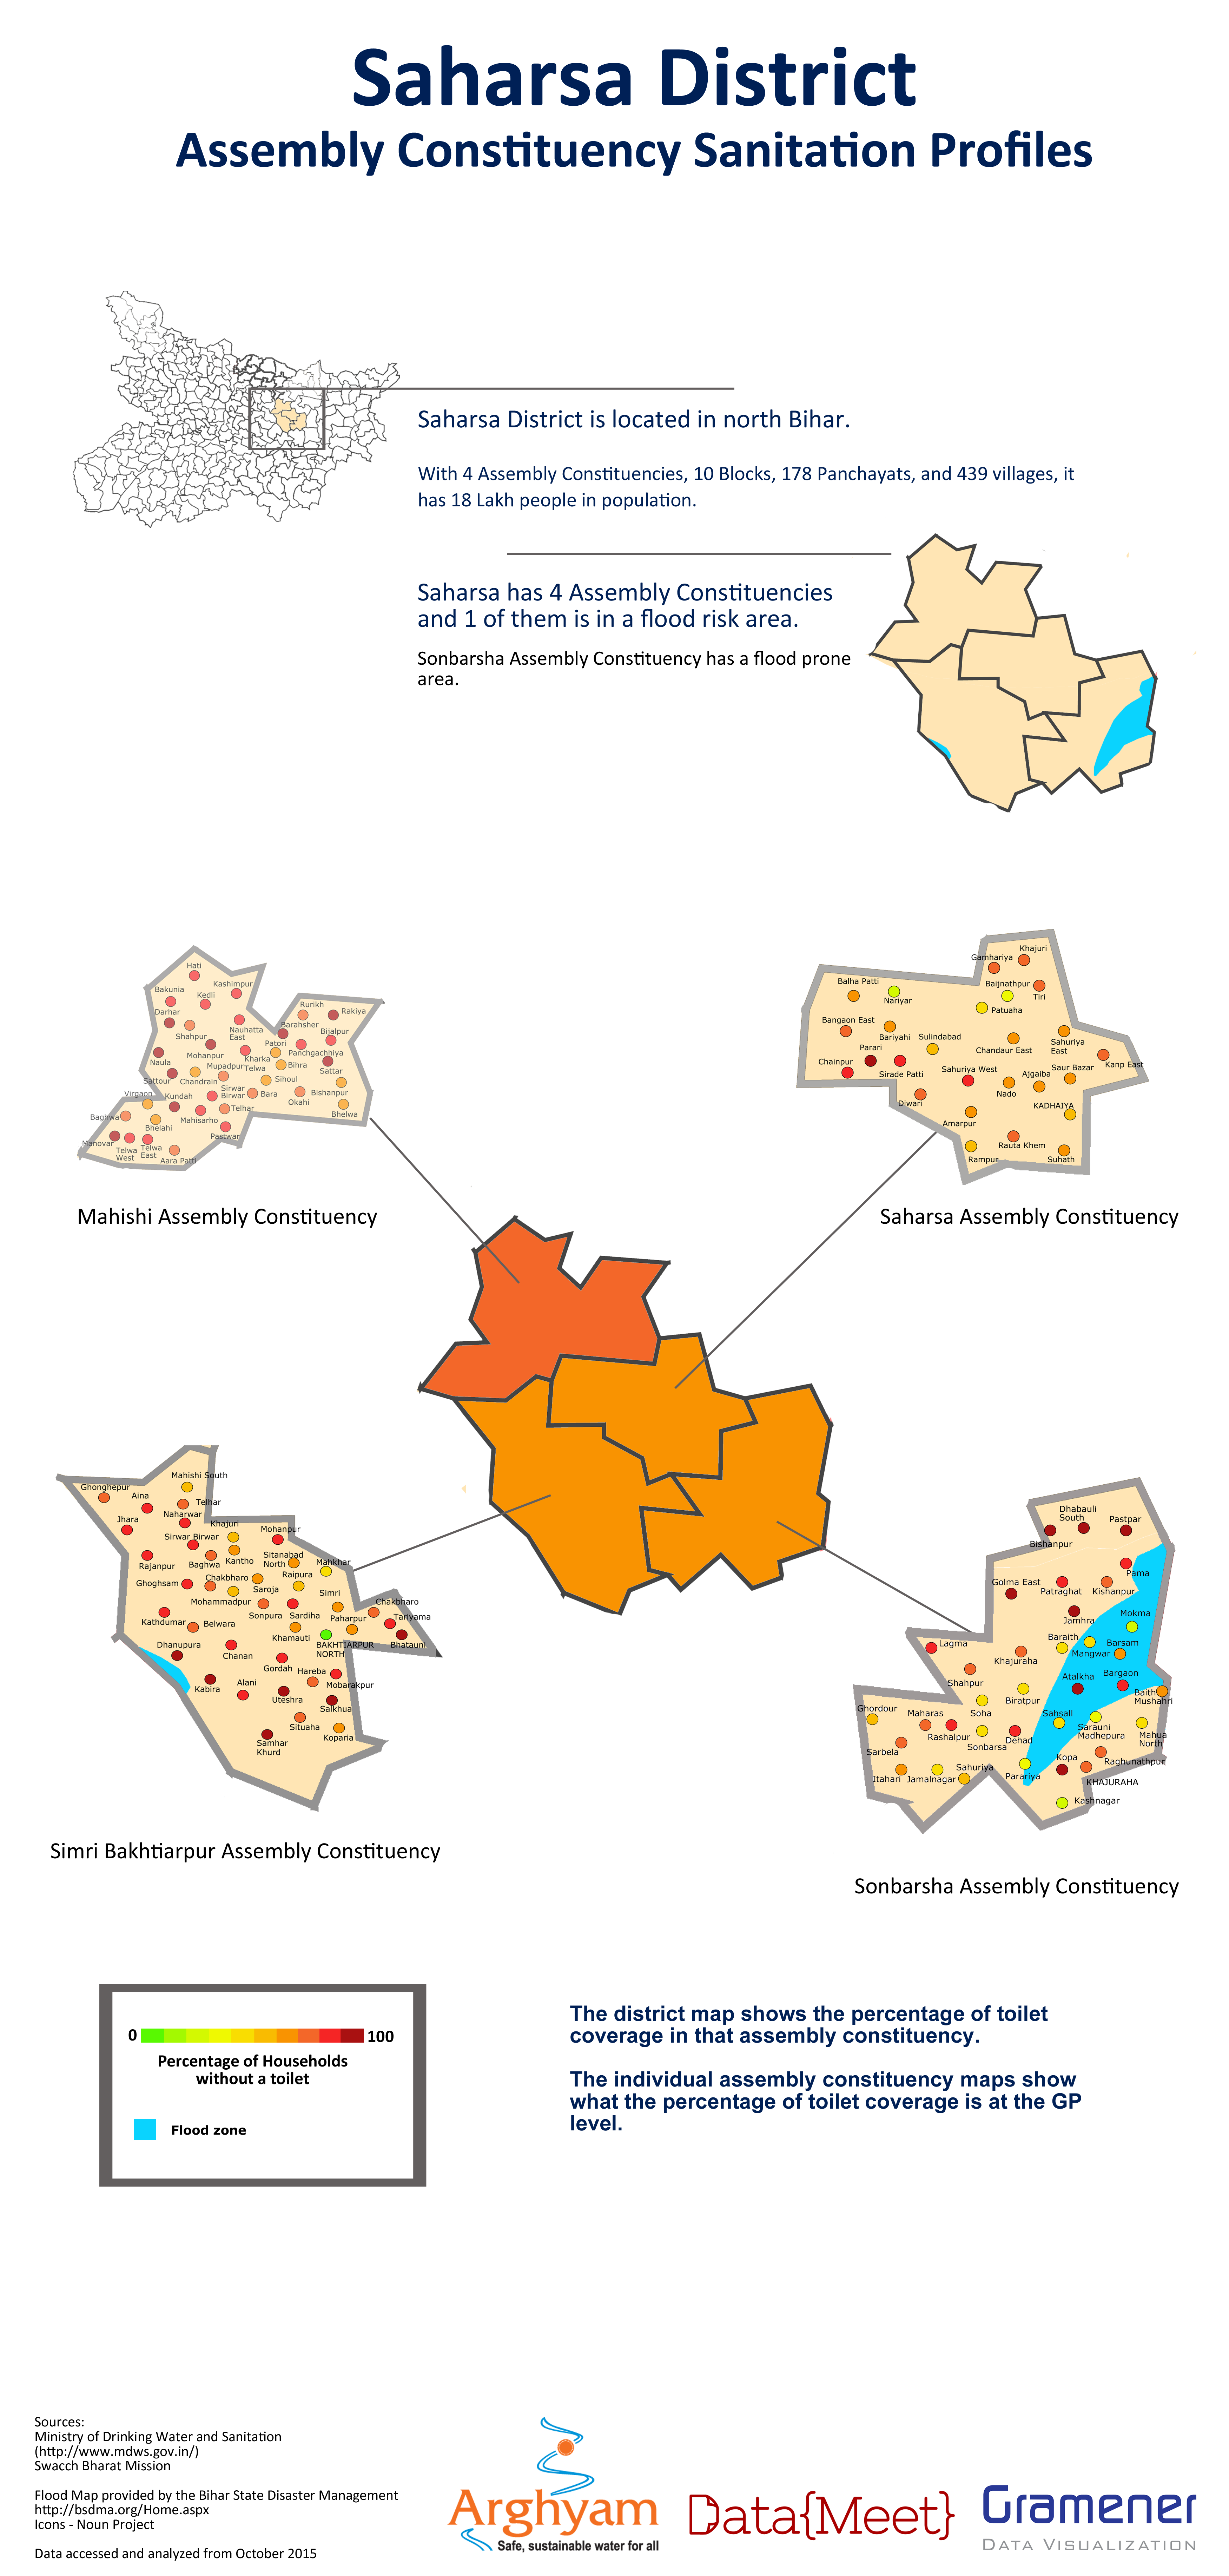
  1. Sanitation coverage for each Assembly Constituency and Gram Panchayat.
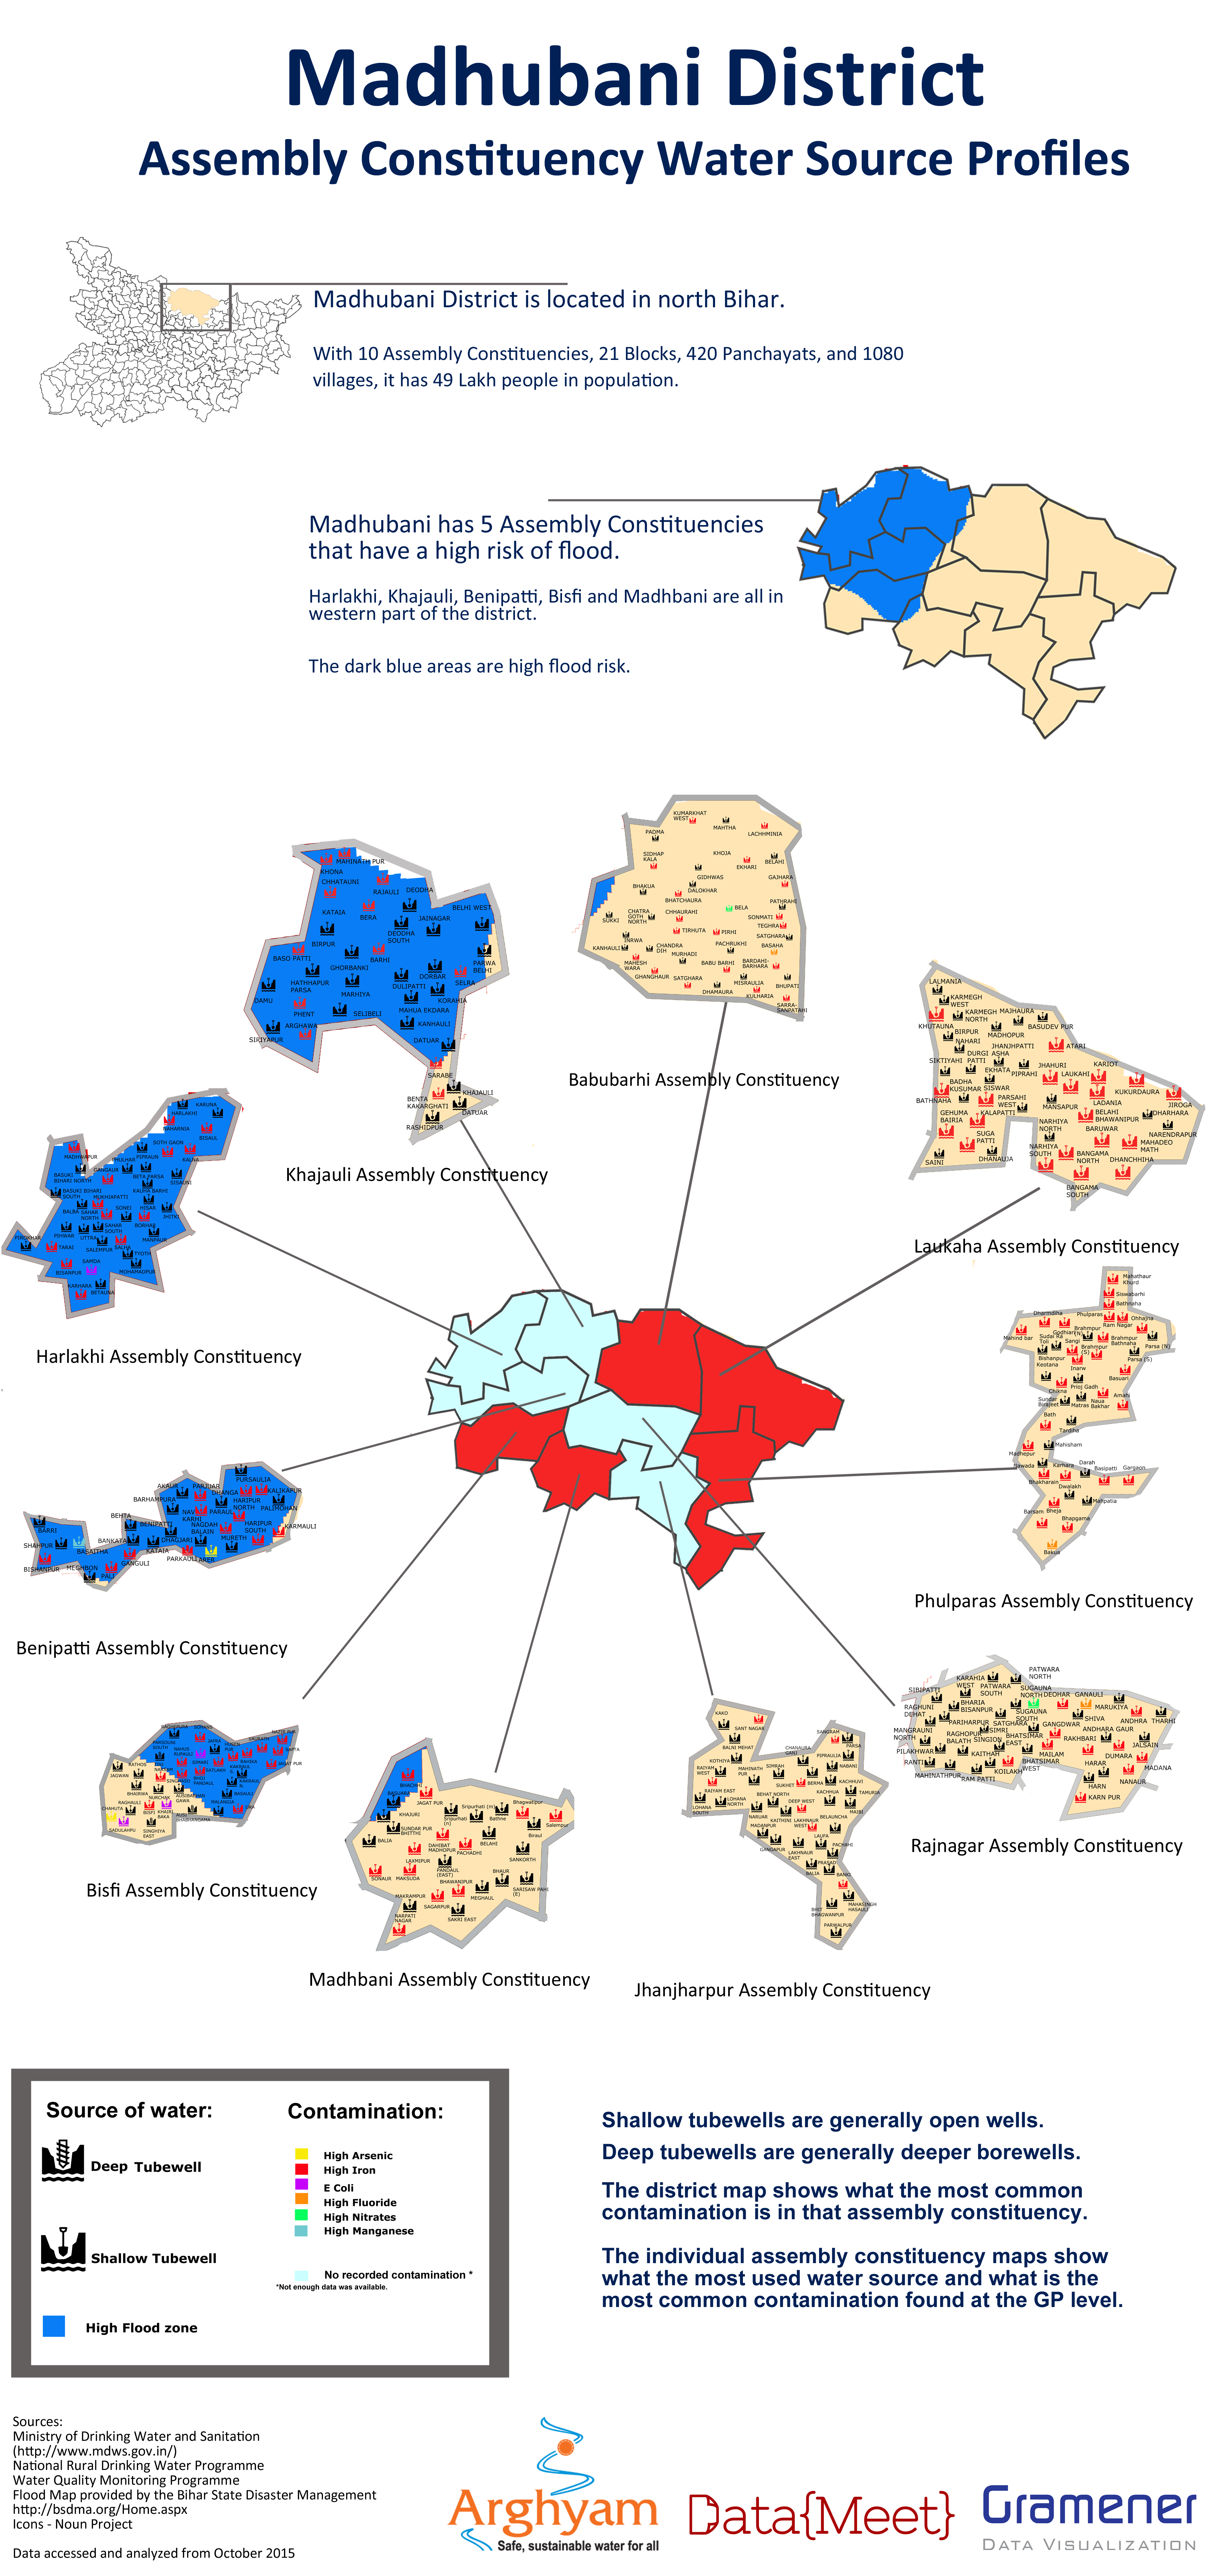
  2. Water quality, what is the contamination situation of the district, Assembly Constituency and Gram Panchayat.
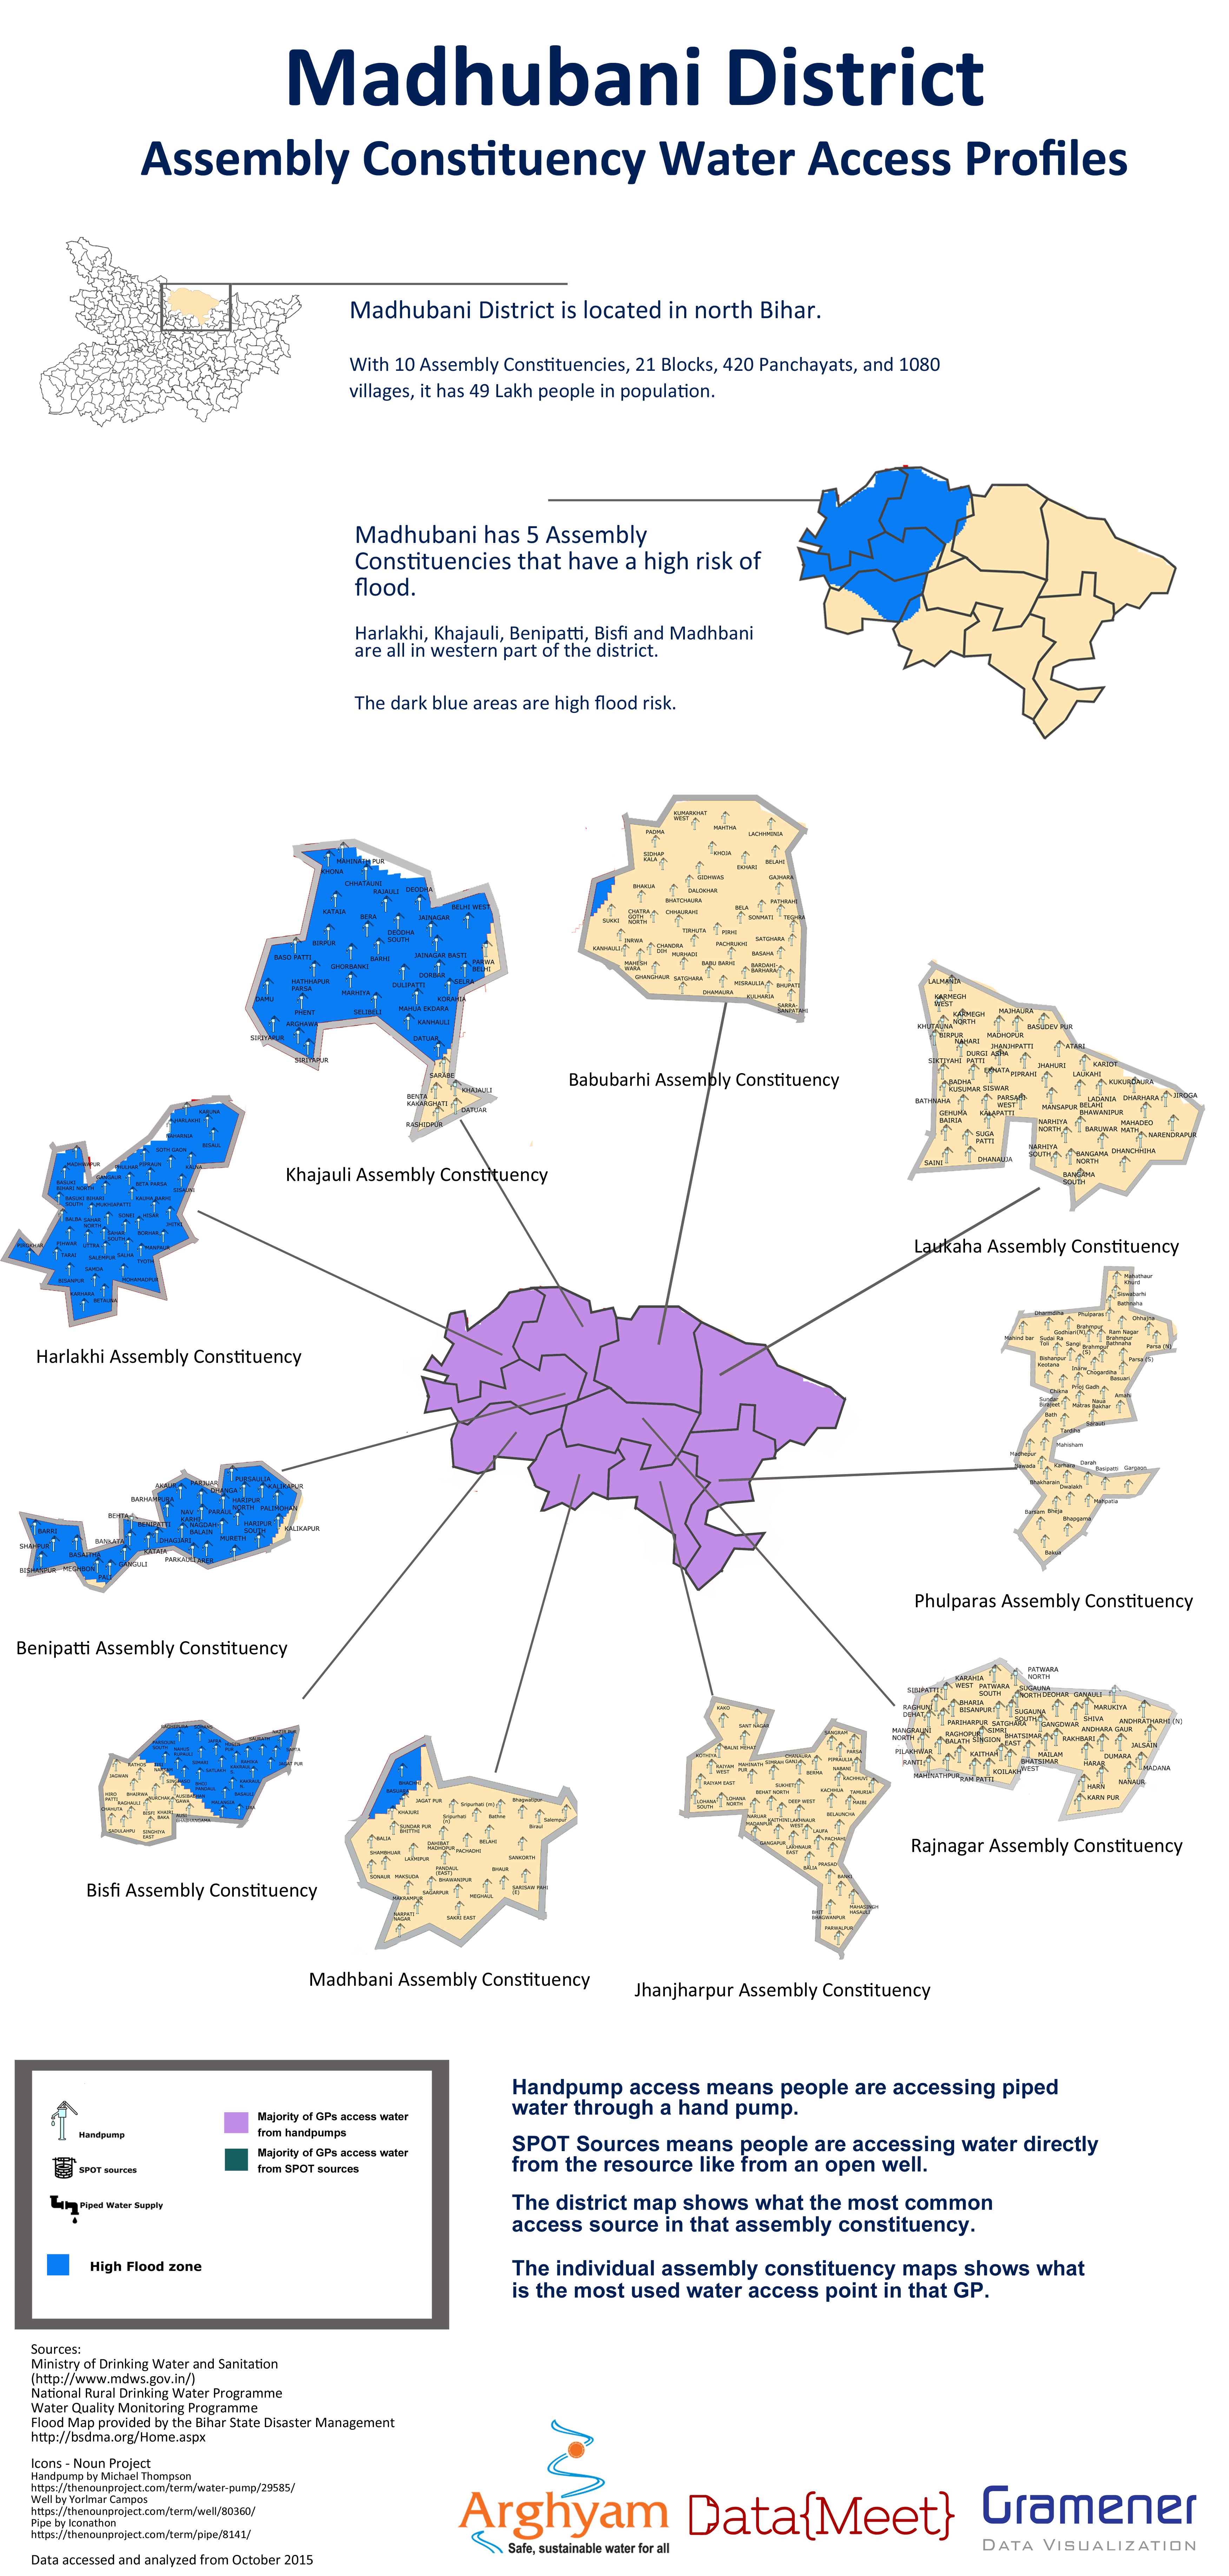
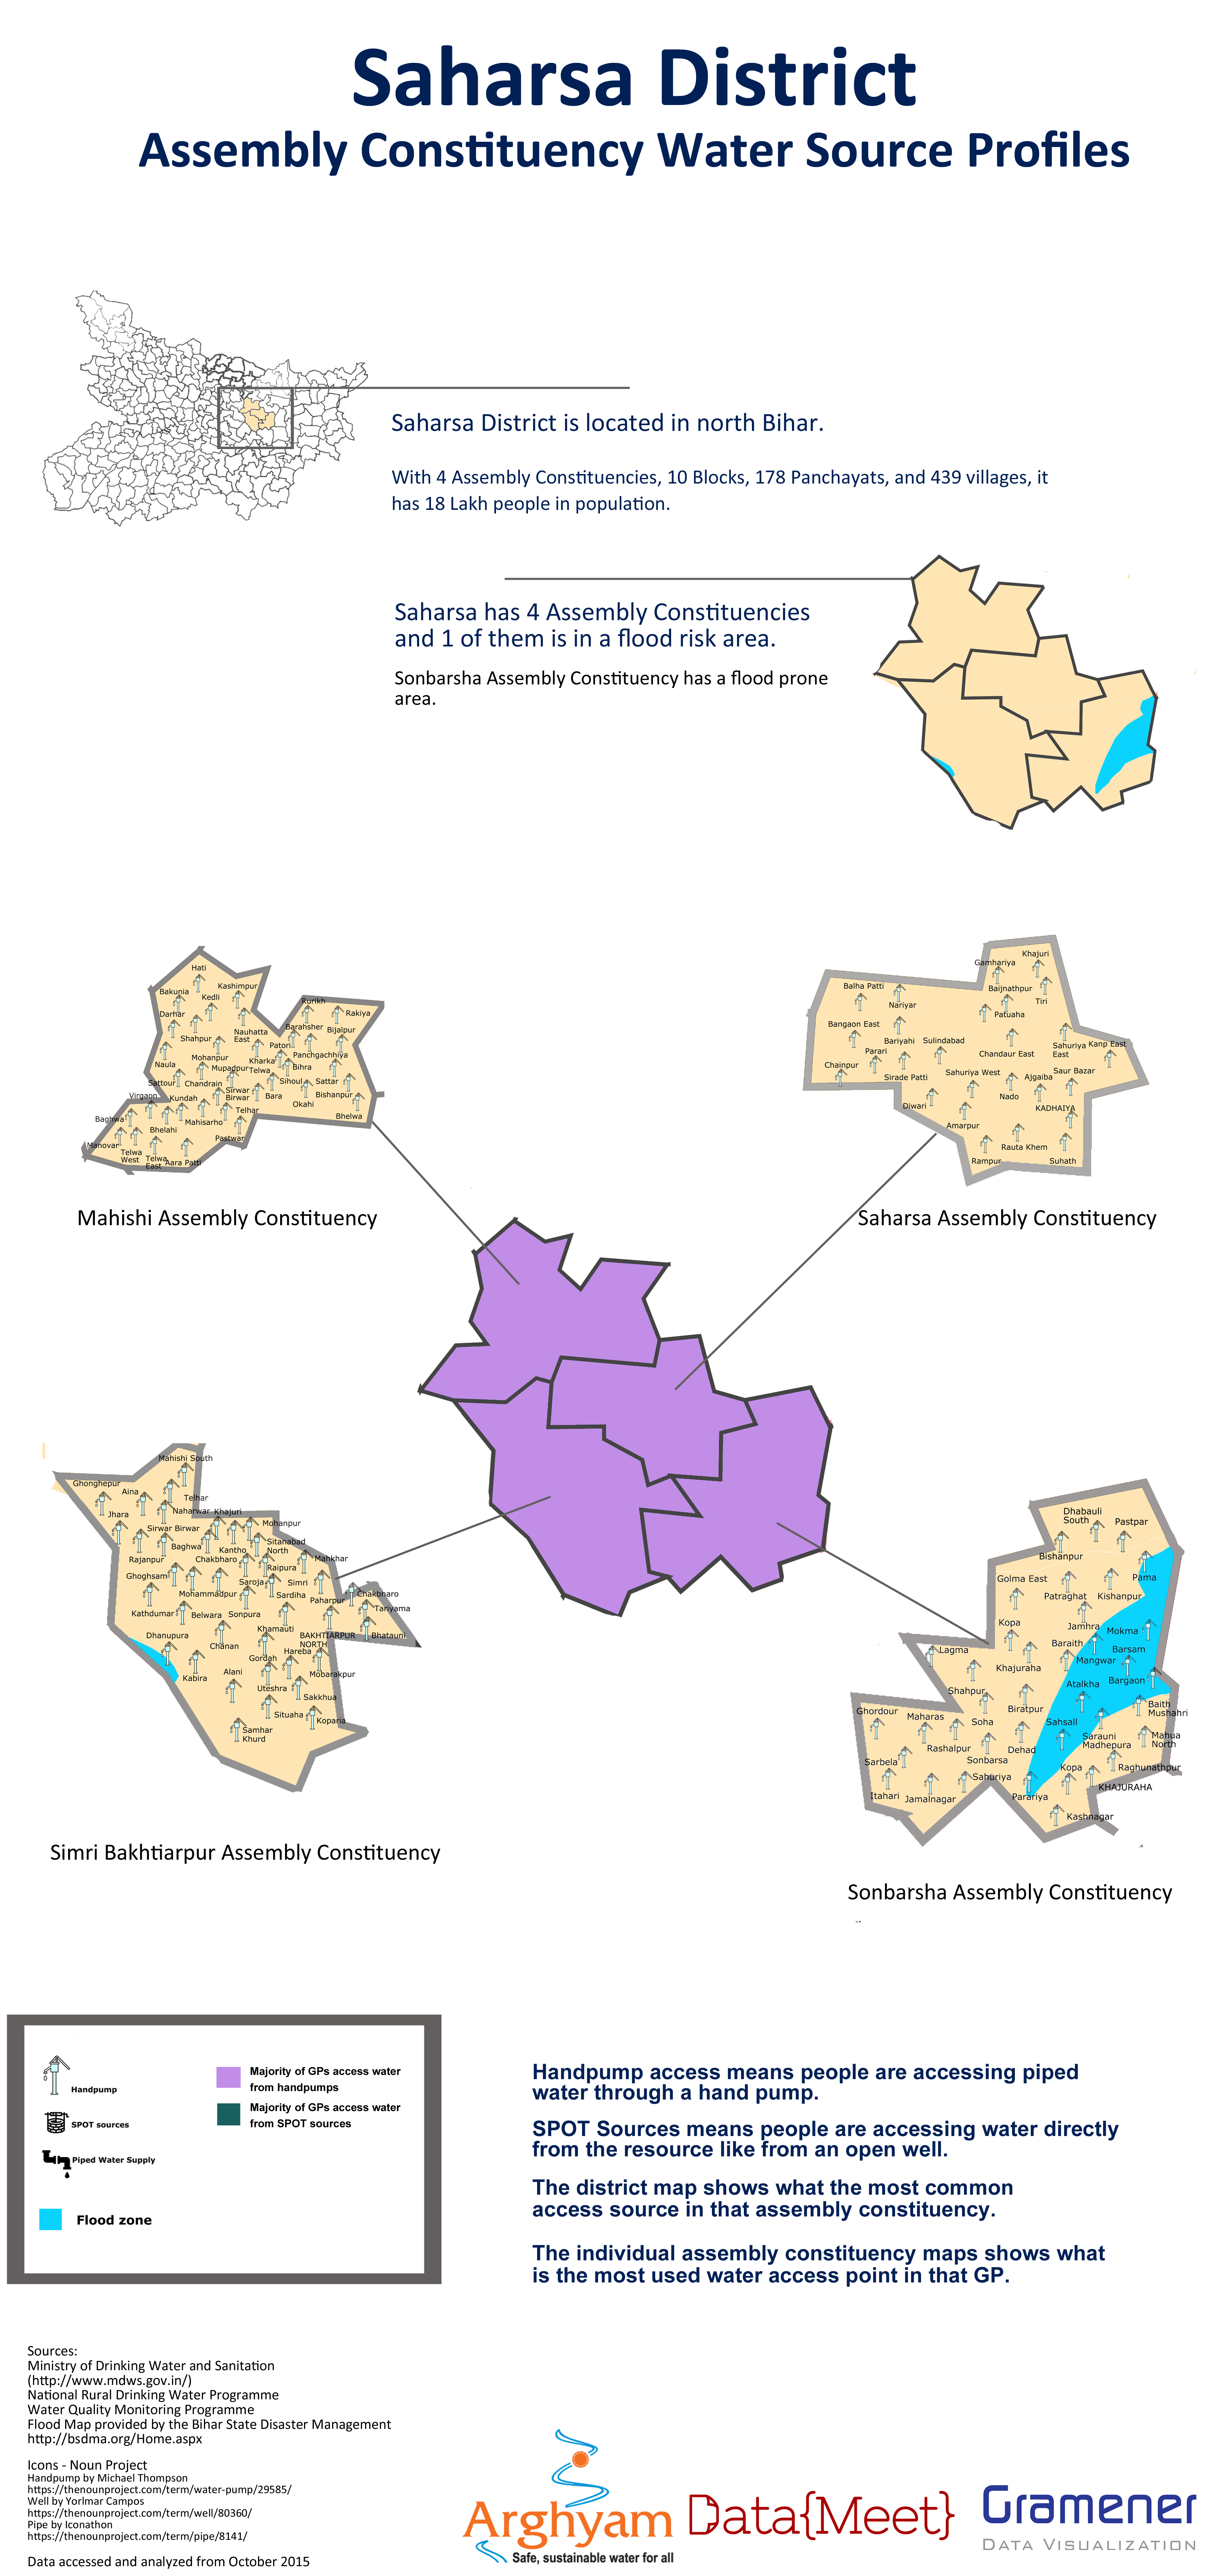
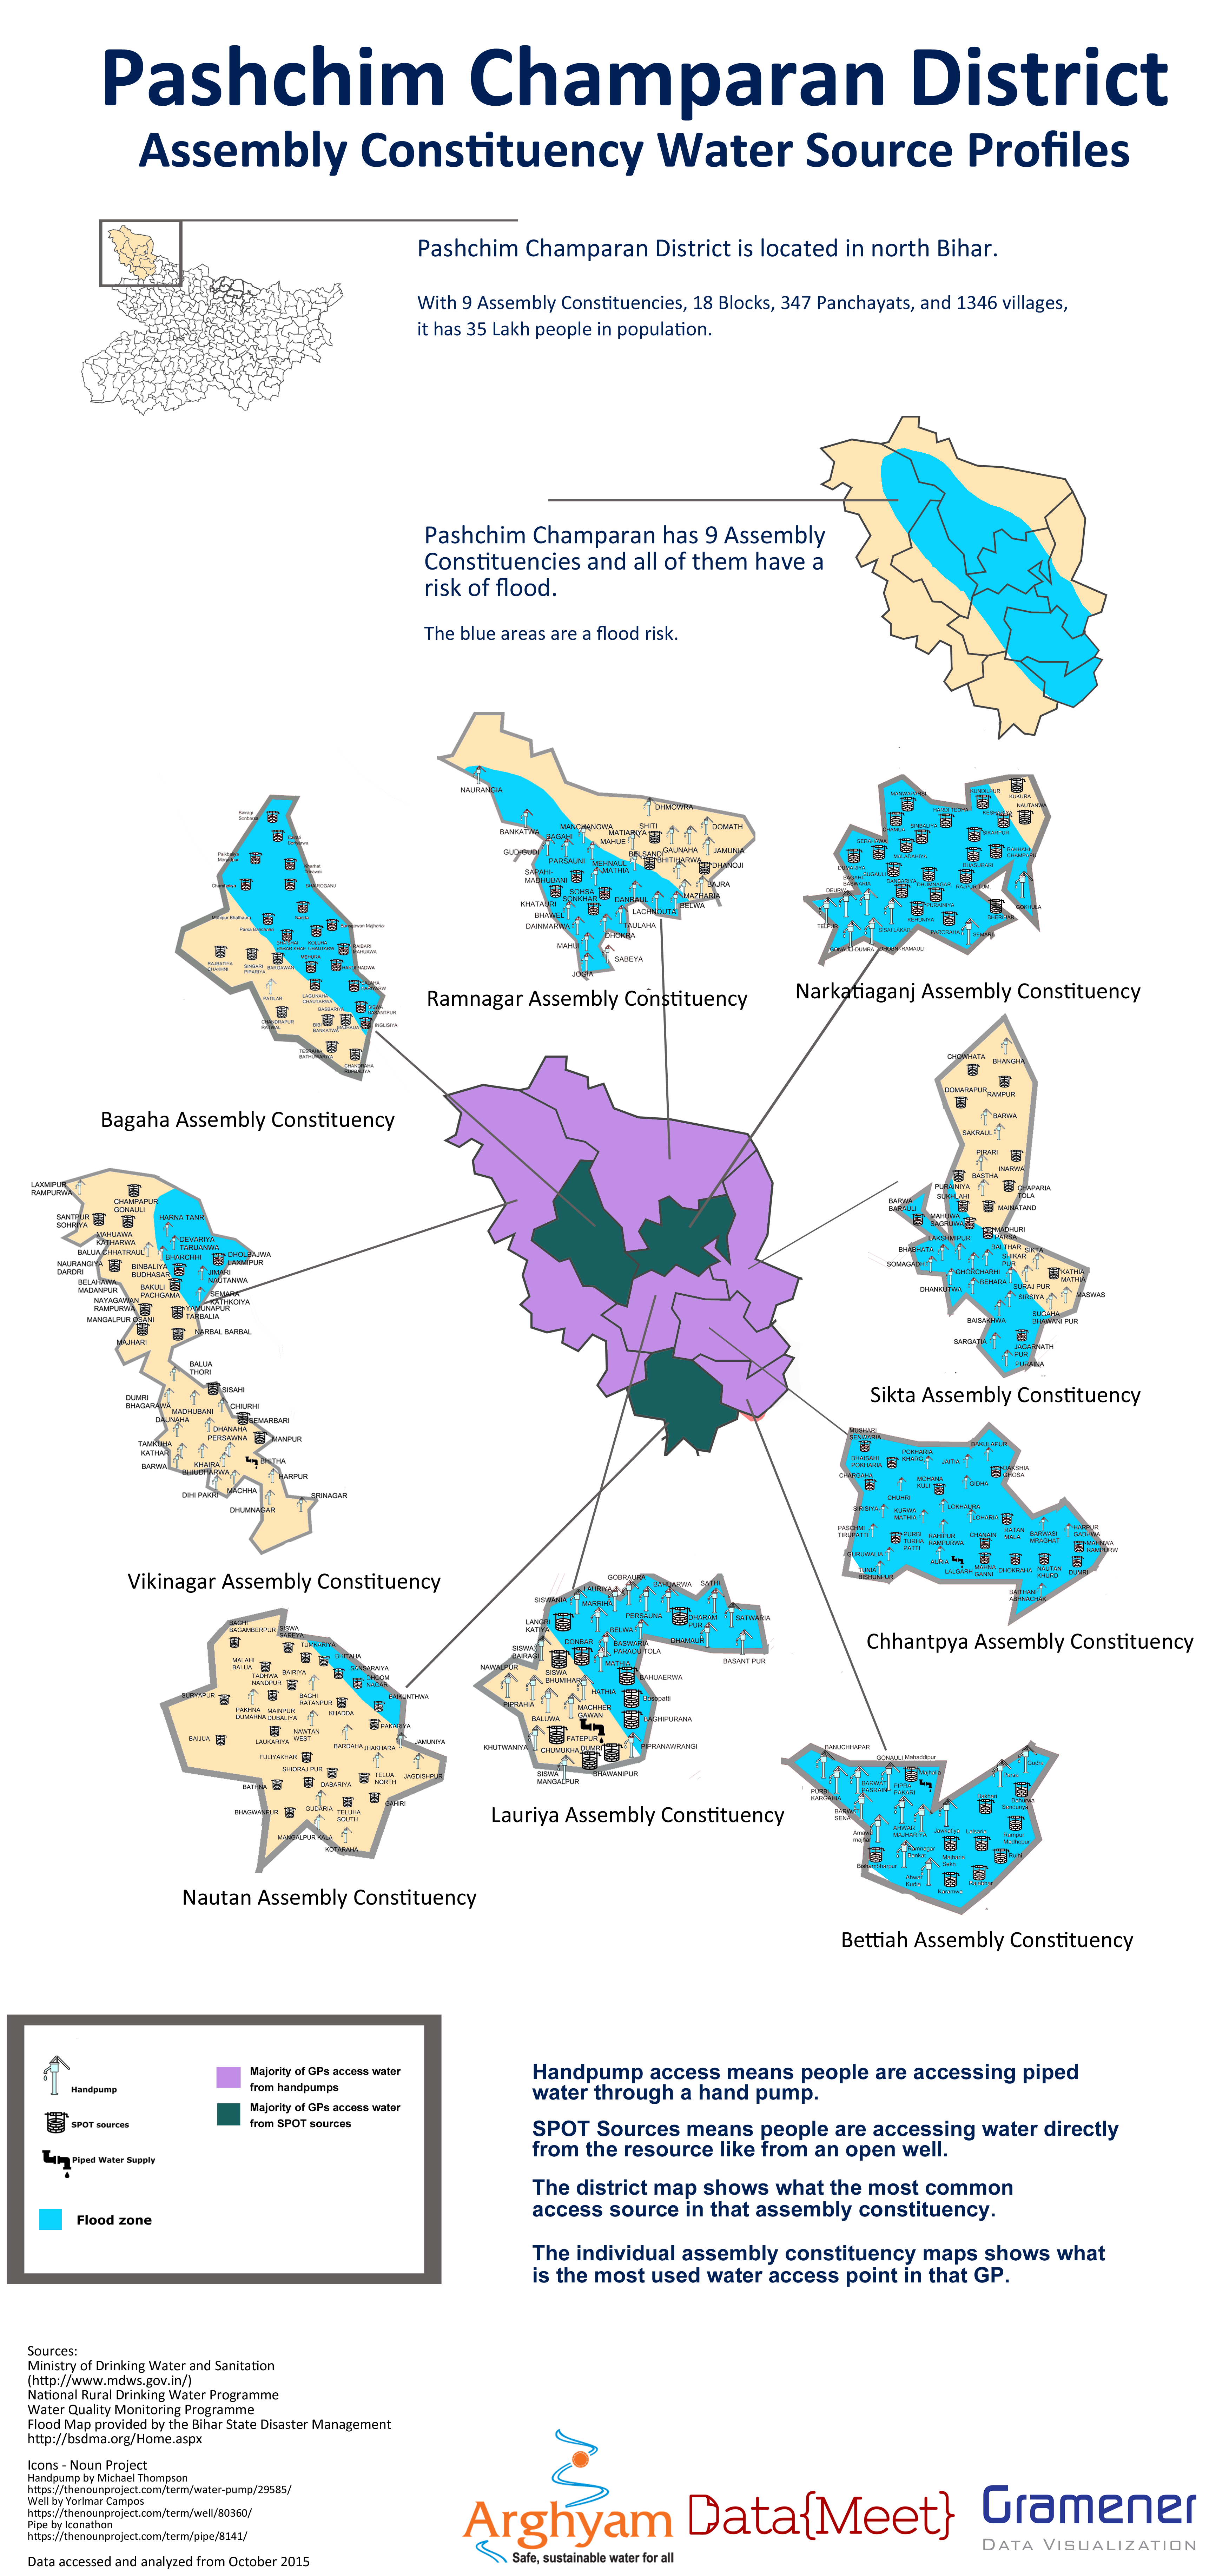
  3. Water access, how do people get their drinking water.

It was also important to understand this data in the context of the flood prone areas of Bihar. For instance if there is an area that gets drinking water from shallow wells, with little sanitation in a high flood area those areas can suffer from high levels of water borne diseases.

The data we got was from

Since we were doing report cards based on Assembly Constituencies we needed the data to be at the Gram Panchayat (GP) level. Luckily the MDWS does a good job of collecting data all the way down to habitation so GP level data was available.

There is no official listing of what GPs are in which Assembly Constituency so the partner was asked to split the data by AC so we wouldn’t have to do that mapping. They agreed they knew the area better and would have the resources to pull together all the GP level data into organized Dropbox folders grouped by districts then split into ACs.

Data Cleanup

We received one PDF file per GP,  for water access and number of toilets, water quality was given in one large file by district.

All the data we received was in PDF. This was a huge hurdle as the data was from the government information management system so it was from a digital format but rendered in a PDF this meant that we had to convert unnecessarily. However, since the ground partner picked the data they needed and organized it by AC we wanted to make sure we were using the data they specified as important. So we decided to convert the data. This job was done by Thej and I and was extremely manual and time consuming and caused some delay in the data being sent to the analysts.  (See how we did it here.)

Analysis

The analysis required was basic. They needed to know at an AC level what the sanitation coverage was, the sources of water, how people were accessing it and what the water quality situation is.  Rankings compared to other districts and ACs were done to give context. Rankings compared to other districts and ACs were done to give context.So in all the analysis stage didn’t take much time.
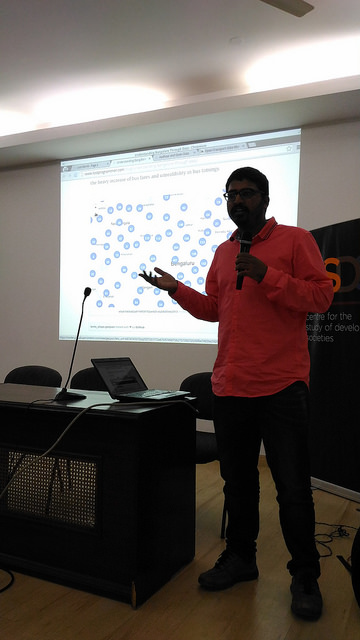
Example of Analysis


Visualization

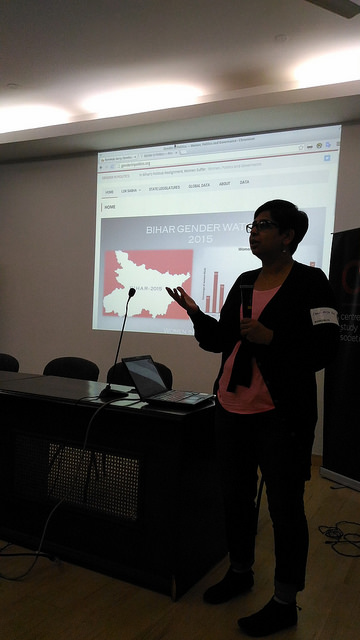
The UNDP along with the Bihar State Disaster Management Authority had created a map of diaster prone areas including flood. It was in PDF so we asked the folks at Mapbox India to help out with creating a shapefile for the flood map so we layer flood areas onto the Assembly Constituencies.

Bihar AC map with flood prone areas


While we had AC maps we didn’t have GP level maps. They didn’t seem to be available and we couldn’t find them in PDF form either.

Since the election is staggered by district we started with Khagaria. After the initial report cards were done the partner wanted just the cleaned up data in tables to use for their meetings. So we then decided to do the report cards, clean up the data and send the spreadsheets over to them.

As we were processing the next 4 districts I found GP level maps of Bihar, with boundaries of ACs included. This was quite exciting and I thought since we had some time we could do maps for the four pending districts.

After receiving the analysis for the next district I decided that since it would take to long to trace the PDF maps, so the analysts could map the GPs, I would just over lay them onto our AC shapefiles in Photoshop. I was going to put icons or circles in the center of the GP and that would be the map. While tedious I figured it would be worth it to show the maps to the ground partner.

However, when I started mapping I realized that analyzed data wasn’t matching up with the GPs on the map. The GPs listed in the Assembly Constituency in our original folders were incorrect, which meant all the analysis was wrong. Everything had to be checked against the maps and reorganized in the final datasets and then reanalyzed. This caused a huge delay.

On top of that the GPs on the map were spelled differently than in the MDWS data, and every dataset potentially had a different spelling of a particular GP. Which meant the remapping of the data had to be done manually looking at the map, the data, other sources, and sometimes guessing if this was the correct GP or not. This ended up being a manual process for every AC, as we didn’t do this mapping and standardization in the beginning.

While the delay caused problems with the maps being used in the election, they were worth doing to understand the problems with the data and the ground partner identified with the maps the most. By the end we were able to produced districts posters for the different parameters.
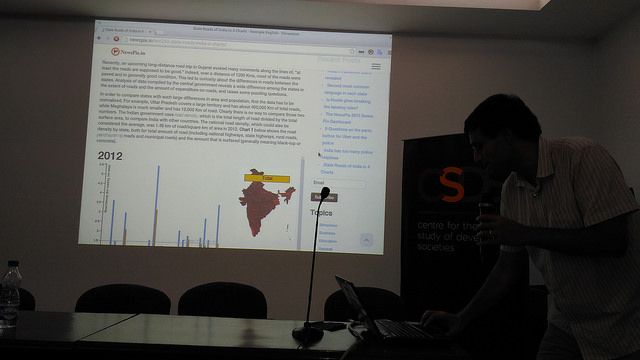
Sample report card


Final Posters

PC_sanitation copy poster madhubani_wateraccess copy poster madhubani_sourceprofileposters madhubani_sanitation poster Supaul_wateraccess copy poster copy Supaul_sourceprofile poster copy Supaul_sanitation copy poster copy Saharsa_wateraccess copy poster copy Saharsa_sourceprofile poster copy Saharsa_sanitation copy poster copy PC_wateraccess copy poster PC_sourceprofile poster


Lessons for next time

We learned a lot from this process. Mainly that the issues with standardization of Indian names in data is a real concern. While initiatives like Data.Gov.In are an important first step, it will take real will and dedication to work out this problem.

NGOs and groups that don’t work with data at the scale of modern data techniques are not always familiar with issues like formats, standardization problems, data interoperability,visualization and mapping to other datasets. This means that more time needs to be spent getting the intentions of the project out of the partner not just outputs. Problems like PDFs are not things everyone thinks about so the extra time of working with the partner to understand what data they want and find way to get it are better spent then converting PDFs to CSV if we don’t have to.

Designers are important, I created and designed the maps and posters, while I’m proud of them, they could have been done better and faster by a trained designer. Designers are worth the money and effort in order to make the final product really reflect the care and work we put into the data.

I consider this experience a success, despite the setbacks, we learned how to manage a team that was not full time and how important the initial work with the ground partners are to create realistic deliverables and timelines.

You can get all the data on DataMeet’s github page. 

Big thanks to the Gramener team – Santhosh, Pratap and Girish for dedicating their free time to this.

Sikkim

#LATEPOST

Sikkim State Government passed an open data policy Sikkim Open Data Acquisition and Accessibility Policy in 2014. With pushing from the Chief Minister and Member of Parliament the Honorable Prem Das Rai they turned to open data to take control of the state’s data. The Honorable Mr PD Rai has repeatedly mentioned is the lack of access to government information on demand. It is not uncommon for lawmakers to ask questions only to have to wait a day or more for the answer and lose a moment to use that information for decision making.

An Open Data for Human Development Workshop was organized by the International Centre for Human Development of UNDP India, with the Centre for Internet and Society, AKVO, Mapbox and DataMeet co-facilitating the event in Bangalore last June. The aim was to bring together members of the Sikkim government, IT professionals, and open data enthusiasts.

20150416_124455

In April before the workshop Sumandro (CIS) and I went to Sikkim to have a pre consultation with the Sikkim government on how to prepare for the large workshop in Bangalore. We met with the MP and the heads of the Rural Development, Health, and IT departments to discuss their plans to implement their open data policy. Then there was a large meeting with all the departments and the MP. We presented different things you can do when data is opened and offered suggestions for how to implement the policy. 20150416_123613The departments took turns discussing their issues regarding implementation; concerns like server space, technology needs, how to create incentives to accurate and timely data uploading were shared.

We presented things for them to think about in a preparation for the June event and for how to work with the open data community in India.

In June the workshop was held as NIAS. Thej gave a session on data tools that can be used to assemble, clean, analyze, publish and visualize data. Some of the tools that he introduced and used during the workshop are

  • Tabula Its difficult to extract data from PDFs. But Tabula allows you to extract that data into a CSV or Microsoft Excel spreadsheet using a simple, easy-to-use interface. Tabula works on Mac, Windows and Linux.
  • Open Refine – is a powerful tool for working with messy data: cleaning it; transforming it from one format into another; extending it with web services; and linking it to databases like Freebase.
  • DataWrapper allows you to create powerful charts very easily.
  • CartoDB is the Easiest Way to Map and Analyze Your Location Data

“Overall interaction was great. Delegates from Sikkim were very interested in DataMeet community and work we do as community. Some part of the workshop was used to introduce the community aspect of Data.”

You can see the full notes of the event at Centre for Internet and Society’s blog.

We are looking forward to see Sikkim be the first state to implement an open data portal using the Data.Gov.In platform.

2nd Open Data Camp Delhi!

Last Su23024327289_8965388572_znday DataMeet Delhi hosted their 2nd Open Data Camp!  60 people decided to spend their Sunday with us to discuss Digital India and find ways to make this programme more Open and Transparent.

The Delhi chapter decided to examine the role of openness in Digital India, especially how the open data agenda should be integrated into the initiative.  Digital India is the flagship programme of the Government of India to harness the possibilities of information technologies for accountable governance, effective citizenship, and a productive and job-creating digital economy.

This event also explored the recent international push towards better global availability of interoperable 22569224613_8e3f363c28_zand comparable data, such as the Data Revolution for Sustainable Development initiative of UN and the International Open Data Charter introduced by the Open Data Working Group of Open Government Partnership.  The discussion looked at these wider conversation in the keynote and the morning panels.


22802412497_c26edf6786_z

Keynote: Honourable MP from Sikkim P.D. Rai.

The MP from Sikkim started off the day by talking about his experience setting up the first state level Open Data Policy, Sikkim Open Data Acquisisiton and Accessibility Policy (SODAAP),, and why it was important for them to take control of the state’s data through openness.

He stated the the “lack of reliable, structured, and proactively available data is a key barrier to good governance.”  So the SODAAP would allow state legislators to get access to data as they need it instead of having to go through the current structure of asking the Centre for data.  “Why is it that we have fancy phones but we can’t get data on public policy & schemes on it for good decisions.”

When asked how to get government to change he stated, “I’m not the executive, I’m a lawmaker. I don’t represent the government.  I question it as much as you do.”


22878462477_005b2bb8d1_z

Open Data and Digital Governance

Anoop Aravind, Konatham Dileep, and Nikhil Pahwa


This panel focused on the Digital India from a government and journalistic point of view of Digital India.  The panel had a representative from Telegana, KPMG who is implementing E-Panchayats, and from Media Namma.

Dileep the Digital Media Director for Telegana pointed out that the government is the biggest creator of data but they are not set up to share, and are not encouraged to.  Anoop from e-Panchayats pointed out that there are technical issues with implementation and technology infiltration at the local level.  He said the biggest problem for them is the lack of mapping data that can used to help with planning.

Nikhil from Media Namma made the point that the government should proactively disclose data, “why do we need to get personal relations to get the data?” but this doesn’t replace people’s right to ask for information and not just rely on information provided by open data. Right to Information is still vital and this includes an expanded effort to protect people’s privacy.

When asked what are the challenges of openness for Digital India? That despite the big fanfare there is uneven implementation and issues that have to be solved before the dreams of Digital India are realized, and that people have to work with the government to show them the reason to be open.

22573760283_24bbf8c618_z

Open Data and Digital Citizenship 

Bhanupriya Rao, Dr. Biplav Srivastava, Nic Dawes, and Shashank Srinivasan

Bhanupriya Rao an RTI activist described out RTI has a pro-active disclosure requirement, however, it is not in practice and without that RTI is the best tool for now.  There is no right to data concept.

Nic Dawes described journalism as a constitutional mandate and went on say that that open data and journalism communities must work together more.  Journalists can deal with biases, data interpretation issues, graphic presentations, and tell compelling stories using tech and design.

Biplav Srivastava spoke about the need to move toward smart data consumption, for policy decisions and  individual decisions. That the next steps are data integration/re-use/standards, and linked data for analytics.

Shashank Srinivasan shared his experience with open data for conservation (WWF), how they consume OSM data for needs of protecting wildlife. What are risks for crowdsourcing for wildlife conservation?  Open data can be a problem for conservation, control over the end user is needed.

Questions to consider:

How can open data improve our work? How can academia and open data converge? Can donors influence on releasing data? What does it mean to be a digital citizen?

Lightning talks

22904542059_ebbabfda5f_z

Guneet from Akvo shared their smart phone app that detects Fluoride levels in water.


23272573835_0385565697_zManing from  HotOSM shared their work around the world providing maps during natural disasters, including the Nepal Earthquake.

23246505476_516b00ee42_z


Transport Working Group shared the work looking at bus data in Delhi.


22644205814_d6371e4e92_z

Bihar Gender Watch shared the work of looking at the gender split in elected bodies.


22644166574_0762baa26b_z


NewsPie is an online news site, they shared the data work they have done in roads and around net neutrality.


23309891061_7dd47539fb_z


Aditya Dipankar shared his work designing information.


23096714180_58a2a19d0b_zAruna from MapBox shared their work mapping road naming.


23246355216_623bf9ac92_z


Turam shared his project that built more data collection tools on the Open Data Kit.


23366323936_8626537cba_z


Yogesh from Random Hacks of Kindness  (RHOK) on his vision for an open revolution! Also the work of RHOK in India bridging gaps between organizations on the ground and technologists.


23392480785_b93d014558_zMonish Khetrimayum a PHD student spoke about big data, governance and citizenship.


22765320053_cb6f372d33_z


Rakesh from Factly describes how they use RTI information and open data to make sense of information for journalists and citizens.


Group Activity: Response to Digital India

23392506025_19a0dc0b66_m23096736470_c0465ba3d0_m
23024525899_51faa6ca1e_m23284061752_aa07440544_m

Groups were formed to discuss each pillar and come up with questions.

We have gathered all the questions and put them in the DataMeet hackpad, you can find each pillar here.

Please feel free to take a look and add more questions and dataset requests.

After a week’s time we will be gathering everything and writing a letter of request for openness to Digital India and the various departments, DIETY, to ask them to make this information available.

It was a fantastic day! DataMeet Delhi did an amazing job putting together really interesting speakers to make this a well rounded interactive event.

Thank you especially to the sponsors for helping make this event great!

  • SARAI for the space
  • AKVO for travel
  • ICFJ for food and other support.
  • RHOK for travel

{Ahmedabad} – First Meeting

Data{Meet} Ahmedabad chapter was initiated on 7th March 2015. 25 souls attended the first meeting. The venue was SAATH Charitable Trust.

The meeting started with an introduction of the organizers, and a quick round of introductions from the attendees. We had a mix of students, researchers, professionals, and entrepreneurs. The idea and importance of a community built around open data, as we at Data{Meet} represent, was described to the members. Shravan and Mahroof, co-organizers of the chapter, shared the brief history of how Data{Meet} came to be, and how Thej and Nisha were instrumental in initiating the community.

20150307_192403

Shravan gave a lightning presentation about community mapping using OpenStreetMap and briefly explained the editing features. Apart from OSM, Shravan was also found promoting {;-)} mapbox. Aditya (the third organizer) shared a few Infographics on sanitation in India, the Indian railways, and the military capabilities of Asian countries that he created at Folo (folography.com).

The meeting itself was quite active, with people wanting to know more about how we as a community would work, what platforms we would use, privacy issues, possible data applications for Ahmedabad etc. Arun was eager to know whether OSM could be used to map customers privately. Mahroof mentioned the data initiative of the Indian government data.gov.in and how some additional work is needed to bring all the disparate data for them to be more useful to the public. There was a general agreement that lots of data is available from various sources, but not in an easily usable form. Some discussion also happened around voters ID, Adhaar, the Social Security number of USA, and the possible privacy issues. We ended up discussing various issues for about 2 hours, until we closed at 9 PM. For a first meeting of strangers, our event was a huge success with small discussions happening even after the meeting was formally closed. Everyone was urged to join datameet@googlegroups.com .

We had shared a form with DMers to collect ideas for future activities of D{M}Ahmedabad. Suggestions have come for conducting data workshops, and apart from opening up data, using data in some way to help decision making. It was also suggested to have sessions for people who are not well versed in data technology to learn from. I guess we are looking ahead for some interesting workshops and data parties. A few members have indicated that they could conduct sessions in future meetups. Gentlemen, we will be knocking your doors soon !

On another note, the group was almost entirely made of men, with just three women in attendance. Thank you Vishakha, Tanushree and Bhuvana for joining. We hope that our next meetup will have more of you.

A big thanks to Mr. Niraj Jani for agreeing to host us at SAATH, and for the tea. Thank you Aditya@Folo for bringing us yummy samosas.

Please stay tuned for our second meetup in April !!

Open Transit Data for India

(Suvajit is a member of DataMeet’s Transportation working group, along with Srinivas Kodali, we are working on how to make more transit related data available.)

Mobility is one of the fundamental needs of humanity. And mobility with a shared mode of transport is undoubtedly the best from all quarters – socially, economically & environmentally. The key to effective shared mode of transport (termed as Public Transport) is “Information”. In India cities, lack of information has been cited as the primary reason for deterrence of Public Transport.

Transport Agencies are commissioning Intelligent Transport Systems (ITS) in various mode and capacity to make their system better and to meet the new transport challenges. Vehicle Tracking System, Electronic Ticketing Machines, Planning & Scheduling software are all engines of data creation. On the other side, advent of smart mobile devices in everyone’s hand is bringing in new opportunities to make people much more information reliant.

But the demand for transit data is remarkably low. The transit user and even transit data users like City Planners should demand for it.
The demand for Public Transport data in India should be for the following aspects:

A. Availability
To make operation and infrastructure data of Transport operators easily available as information to passengers in well defined order to plan their trip using available modes of Public Transport.

B. Interoperability
To make transit data provided by multiple agencies for different modes (bus, metro, rail) usable and make multi modal trip planning possible.

C. Usability
To publish transit oriented data in standard exchange format across agencies in regular frequencies to provide comprehensive, accurate and updated data for study, research, analysis, planning and system development.

D. Standardisation
To be a part of Passenger charter of Transport Operators to publish their data in standard format and frequency. This can also serve as a guideline for Transporter Operator while commissioning any system like Vehicle Tracking System, ITS, Passenger Information System, website etc.

What kind of Transit data is needed ?

  • Service Planning data

It will comprise of data on bus stops, stations, routes, geographic alignment, timetables, fare charts. With this dataset, general information on transit service can be easily gathered to plan a journey. Trip Planning mobile apps, portals etc can consume this data to provide ready and usable information for commuters.

  • Real time data

A commuter is driven by lot of anxieties when they depend on public transport mode. Some common queries; “When will the bus arrive ?”, “Where is my bus now?”, “Will I get a seat in the bus ?”, “Hope the bus has not deviated and not taking my bus stop.”.

Answer to all this queries can be attended via real time data like Estimated Time of Arrival (ETA), Position of the vehicle, Occupancy level , Alert and Diversion messages etc. Transport Operator equipped with Tracking systems should be able to provide these data.

  • Operational & Statistical Data

A Transport Operators operational data comprises of ticket sales, data of operation infrastructure and resources like Depots, Buses, Crew, Workshops etc. As operatore are tending towards digital mode of managing these data it also makes a good option to publish them at regular intervals.

A general commuter might not be interested in this data, but it will very useful for City Planners to analyse the trend of commute in the city and make informed decision. City transport infrastructure can be planned to orient it towards transit needs and demands.

The transport agency can benefit highly by demonstrating accountability and transparency. They can uplift their image as a committed service provider thereby gaining for passengers for their service.

So, together it will make a thriving landscape, if the data creators of Public Transport in India provide their data in Open which can be consumed by a larger set of people to build platforms, applications, solutions for transport study, analysis & planning across different section of users.

Open Transit Data is the tipping point for Smart Mobility in India.

That is why we have started putting our thoughts together and began writing an Open Transport Data Mainfesto.

Data Expedition: Do Din Edition

Do Din is an Hyderabad City Event focused on looking at how Hyderabad is progressing and changing. The organizers Hyderabad Urban Labs and Right to the City have this event every year to create a space to allow people to exchange ideas, understand problems, and share solutions for different aspects of urban life.

As part of my fellowship with School of Data I thought, Do Din would be a great place for us to have our joint data event. We worked with Do Din to make Hyderabad related datasets available and people familiar with those datasets, while DataMeet and School of Data runs the event and provide experts in mapping and design.

We had almost 30 participants throughout the day, from various backgrounds. We explore what data was and the issues around getting it and using it.

Then we looked at the data we had available. We focused on 3 data sets.

  1. Bus Transport data – routes, stops, types of buses, and income of buses.
  2. Slum data – location of slum
  3. Complaints registered regarding lakes in the city.

These were the cleanest and most accessible datasets.

After going through the data and working out the confusing unclear parameteres we split into groups to start working on datasets.

5 groups were there and each worked on a data set.

  1. Group one worked on slum data
  2. Group two worked on the lake data
  3. Group three also worked on the lake data
  4. Group four worked on the slum data
  5. Group five worked on the bus data.

Each group had a mix of technical, design, analytical, coder skills. So we were excited to see the various outputs.

After working through the data each group presented their outputs.

Group One

Produced a basic map of slums and population

Group Two

They had mapped the lakes and then did analysis based on what complaints were registered to each lake.

Group Three

Used Carto DB to make a map of the lakes

Group Four

Made a map of the slums.

Group Five

Did analysis on which types of bus made the most money over the course of their trips.

Learnings

While the outputs were great it was a fantastic exercise in working with datasets and different types of people. Probably one of the best data related events we have hosted.

Project Data Playlist

Finding ways to learn a new way to play and work with data is always a challenge. Workshops, courses, and sprints are a really great way to learn from people. While we will continue to try to bring those events to places around India we wanted to use different mediums to put up lessons, tips, techniques and tools.

There is also an additional challenge of how do we reach out to new communities and people, with different languages and ways of presenting concepts and skills.

We wanted to invite the community and others to experiment in this space by creating video skill sharing playlists.

So instead of a single 10 minute video on how to use Excel we are asking people to create playlists of videos that are between 2 to 5 minutes long that are one concept or process each video.

Anand S presents our first playlist: Formatting in EXCEL:

By breaking up the lesson into chunks and making them separate videos we are asking people add their own.

Don’t like excel? Do one for Open Spreadsheets or Fusion Tables.  Sharing your favorite tools and tricks used for working with data is the main goal of this project.

The next step is translating them into a different languages and offering different ways to teach a concept.

Next week Thej will present a intro to SQL video.

If you want to do one there a few rules:

1) Introduce yourself
2) Break up the lesson by technique and make each video no more than 2 to 5 minutes.
3) Make sure they are a playlist.
4) Upload them to youtube and tag them DataMeet
5) Let us know!

If you have any feedback or a video request please feel free to leave it in the comments. We will hopefully release 2 playlists every month.

Data Journalism Workshop #1

Last Sunday, August 31st, Thej and I worked with an Economic Times Journalist Jayadevan PK to design an intro to data journalism workshop. For a while now there has been quite a bit of interest and discussion of data journalism in India. Currently there are a few courses and events around promoting data journalism, we thought there was definitely room to start to build a few modules on working with data for storytelling. Given that we have not done too many of these we decided to do an introduction and leave it limited to a few people.

Datameet1

20140831_103417

You can see the agenda with notes here and the resources we shared on the data journalism resource wiki page, as well as refer to the data catalog that DataMeet has been putting together.

Thanks to Knolby Media for hosting us and for School of Data (I am a fellow). Thank you to Vikras Mishra for volunteering and taking notes, pictures, and video.

We had four story tellers with us, from various backgrounds. We spent the morning doing introduction and what was their experience with data, what their definition of data journalism is and why they wanted to take this workshop. Then we had them put up some expectations so we can gauge what the afternoon should focus on.


20140831_155101

We then had Jaya go through the context of data journalism in terms of the world scale and the new digital journalism era.

Then we spent some time going over examples of good data journalism and bad.

After we went through resources people can use to get data. We touched upon the legal issues around using data and copyright issues. Then we discussed accuracy and how to properly attribute sources.

Then we demonstrated a few tools

Datameet 5

Tableau
CartoDB
Scraping tools
Scraper wiki
IMACROS
MapBox
QGIS

Visualization Roadmap
The participants thought understanding how to visualize would be helpful.  So we went through a sort of visualization roadmap.  Then went through stories they were working on to see how we would create a visualization and also how to examine the data and come up with a data strategy for each story.

Datameet 6

20140831_155126

Then showed some more tools to address the suggestions from the exercise.
BHUVAN
Timelines
Odyssey
Fusion Tables
BUMP

Feedback session

Datameet2
People wanted another day to let the lessons be absorbed and some more time to actually have hands on time with the tools.  Also even at the intro level it is important to make people come prepared with stories, so they have something to apply the ideas to.

To say we learned a lot is an understatement. We will definitely be planning more intro workshops and hopefully more advanced workshops in the future, we hope to continue to learn what people think is important and will keep track and see what kinds of stories come out of these learning session.

If you want a particular workshop feel free to request one here.  Stay tuned to the blog and to the list to hear about the next one.

Bangalore: Screening of The Internet’s Own Boy

Last Thursday the Bangalore DataMeet did a screening of the Aaron Swartz Documentary: The Internet’s Own Boy.

Aaron was a developer, technologist, entrepreneur, and a passionate open culture and progressive activist, who had been instrumental in creating Creative Commons and Reddit.  Last year when he took his life in the wake of aggressive prosecution by the US Government, for downloading academic journals through MIT’s network.  The open culture/access/data movement was hit by a great loss but also had to pause and take to understand what the actions taken by the government meant.

We wanted to show the movie here and then have a discussion on the Indian context, can this happen here? Can people who believe in open access be targeted as well?  The group was small at the screening as we spent the evening discussing the THE KARNATAKA PREVENTION OF DANGEROUS ACTIVITIES OF BOOTLEGGERS, DRUG-OFFENDERS, GAMBLERS, GOONDAS, IMMORAL TRAFFIC OFFENDERS AND SLUM-GRABBERS ACT, 1985,  or better known as the Goonda Act (a Goonda is a slang term for gangster.)

The Goonda Acts are basically state level laws that provide a legal definition of what a Goonda is in several situations and prescribes ways the police are allowed to deal with them. The law in Karnataka was enacted in 1985 and had recently been amended to include new provisions including new offenders one being the digital offender.

The 1985 act includes the following:

When the Goonda Act can be invoked?

Explanation.– For the purpose of this clause, public order shall be deemed to have been affected adversely or shall be deemed likely to be affected adversely inter alia if any of the activities of any of the persons referred to in this clause directly or indirectly, is causing or is calculated to cause any harm, danger or alarm or a feeling of insecurity, among the general public or any section thereof or a grave or widespread danger to life or public health.”

What powers does the state have?

3. Power to make orders detaining certain persons.- (1) The State Government may, if satisfied with respect to any bootlegger or drug-offender or gambler or goonda or immoral traffic offender or slum-grabber that with a view to prevent him from acting in any manner prejudicial to the maintenance of public order, it is necessary so to do, make an order directing that such persons be detained.”

When is this Act valid or invalid?

(a) such order shall not be deemed to be invalid or inoperative merely because one
or some of the grounds is or are ,
(i) vague ;
(ii) non-existent ;
(iii) not-relevant ;
(iv) not connected or not proximately connected with such person; or
(v) invalid for any other reason whatsoever ;
and it is not, therefore, possible to hold that the Government or the officer making such
order would have been satisfied as provided in sub-section (1) of section 3 with
reference to the remaining ground or grounds and made the order of detention ;

How long can they detain you?

13. Maximum period of detention.- The maximum period for which any person may be detained, in pursuance of any detention order made under this Act which has been confirmed under section 12 shall be twelve months from the date of detention.

Provided that in a case where no fresh facts have arisen after the revocation or expiry of the earlier detention order made against such person, the maximum period for which such person may be detained in pursuance of the subsequent detention order shall in no case, extend beyond the expiry of a period of twelve months, from the date of detention under the earlier detention order.

How can you address the system for wrongful detention?

16. Protection of action taken in good faith.- No suit, prosecution or other legal proceeding shall lie against the State Government or any officer or person, for anything in good faith done or intended to be done in pursuance of this Act.

This Act gives the state a very powerful tool when it comes to dealing with people that have been deemed Goondas.

The 2014 Amendment added more to the list of potential offenders including people who are suspected of rape and acid attacks.  It also included a Digital Offender

What is a digital offender?

“Any person who knowingly or deliberately violates, for commercial purposes, any copyright law in relation to any book, music, film, software, artistic or scientific work and also includes any person who illegally enters through the identity of another user and illegally uses any computer or digital network for pecuniary gain for himself or any other person or commits any of the offences specified under sections 67, 68, 69, 70, 71, 72, 73, 74 and 75 of the Information Technology Act, 2000”.


Several questions come to mind:

  • How has this act been used in the past?
  • Why was there a push to include digital offenders? In some articles it seems software companies are trying to go after piracy.
  • The definitions are vague and can be used in a lot of instances.  If I send my friend a copy of a song that I have purchased, can I now be taken to jail for 12 months?

“The law applies not only to audio and video pirates, but to Facebook, twitter, Whatsapp users too. Here is how the report explains it : “If govt thinks you are planning to send a ‘lascivious’ photo to a WhatsApp group, or forwarding a copyrighted song, you can be arrested”. – One India

According to the Economic Times there is support for adding digital offender in law enforcement as well as software companies.

The Goonda Act is much more stringent and is expected to bring down the offences considerably , said a police inspector in Bangalore who has dealt with cases of offences under the IT Act. “In future, we are likely to see more offences that are digital in nature. It is probably to effectively deal with such crimes that the government has proposed this amend ment. It is more futuristic in its outlook, and is likely to help Bangalore in a big way,” said the inspector, who did not wish to be identified. According to Naidu, the very mention of the name Goonda Act creates some sort of a fear psychosis among people.

“Right now, many people seem to have a casual attitude to digital offences. If the fear of Goonda Act works, it will not just boost the sale of our products but in the process increase the tax revenues of the government,” he said.

The amendment has bolstered the confidence of Bangalore-based start-ups like MRT Studios. “We do a lot of post-production work for films, and visual effects for films and television. While we provide services to our clients by investing in original software, there are others who do the same work using the pirated software for a fraction of the price that we charge. The fear of police will now force everyone to go for legal software,” said M Naveen Kumar, 31-year old founder of the seven-month old company.

There are two sides to every law and what the Aaron Swartz’s experience shows us is that anything is possible, and that intent is not always taken into account.

How do we make sure that the intent of the law is carried out and that people without malicious intent aren’t being unfairly targeted?

How do we examine the Copyright Act and the IT Act and make sure people understand what they entail and know what  they are allowed and not allowed to do?

You can see the movie at this link.  You can see our notes from the meet up here.

Please feel free to leave a comment or add your thoughts to the hackpad.