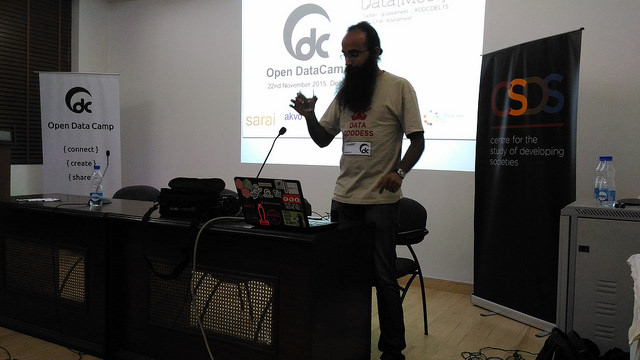
Category Archives: Events

2nd Open Data Camp Delhi!

Last Su23024327289_8965388572_z
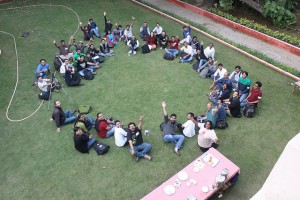
nday DataMeet Delhi hosted their 2nd Open Data Camp!  60 people decided to spend their Sunday with us to discuss Digital India and find ways to make this programme more Open and Transparent.

The Delhi chapter decided to examine the role of openness in Digital India, especially how the open data agenda should be integrated into the initiative.  Digital India is the flagship programme of the Government of India to harness the possibilities of information technologies for accountable governance, effective citizenship, and a productive and job-creating digital economy.

This event also explored the recent international push towards better global availability of interoperable 22569224613_8e3f363c28_zand comparable data, such as the Data Revolution for Sustainable Development initiative of UN and the International Open Data Charter introduced by the Open Data Working Group of Open Government Partnership.  The discussion looked at these wider conversation in the keynote and the morning panels.


22802412497_c26edf6786_z

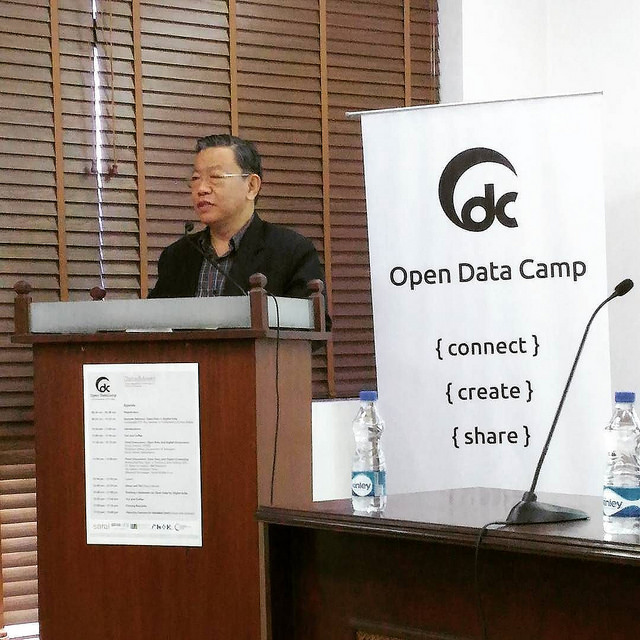
Keynote: Honourable MP from Sikkim P.D. Rai.

The MP from Sikkim started off the day by talking about his experience setting up the first state level Open Data Policy, Sikkim Open Data Acquisisiton and Accessibility Policy (SODAAP),, and why it was important for them to take control of the state’s data through openness.

He stated the the “lack of reliable, structured, and proactively available data is a key barrier to good governance.”  So the SODAAP would allow state legislators to get access to data as they need it instead of having to go through the current structure of asking the Centre for data.  “Why is it that we have fancy phones but we can’t get data on public policy & schemes on it for good decisions.”

When asked how to get government to change he stated, “I’m not the executive, I’m a lawmaker. I don’t represent the government.  I question it as much as you do.”


22878462477_005b2bb8d1_z

Open Data and Digital Governance

Anoop Aravind, Konatham Dileep, and Nikhil Pahwa


This panel focused on the Digital India from a government and journalistic point of view of Digital India.  The panel had a representative from Telegana, KPMG who is implementing E-Panchayats, and from Media Namma.

Dileep the Digital Media Director for Telegana pointed out that the government is the biggest creator of data but they are not set up to share, and are not encouraged to.  Anoop from e-Panchayats pointed out that there are technical issues with implementation and technology infiltration at the local level.  He said the biggest problem for them is the lack of mapping data that can used to help with planning.

Nikhil from Media Namma made the point that the government should proactively disclose data, “why do we need to get personal relations to get the data?” but this doesn’t replace people’s right to ask for information and not just rely on information provided by open data. Right to Information is still vital and this includes an expanded effort to protect people’s privacy.

When asked what are the challenges of openness for Digital India? That despite the big fanfare there is uneven implementation and issues that have to be solved before the dreams of Digital India are realized, and that people have to work with the government to show them the reason to be open.

22573760283_24bbf8c618_z

Open Data and Digital Citizenship 

Bhanupriya Rao, Dr. Biplav Srivastava, Nic Dawes, and Shashank Srinivasan

Bhanupriya Rao an RTI activist described out RTI has a pro-active disclosure requirement, however, it is not in practice and without that RTI is the best tool for now.  There is no right to data concept.

Nic Dawes described journalism as a constitutional mandate and went on say that that open data and journalism communities must work together more.  Journalists can deal with biases, data interpretation issues, graphic presentations, and tell compelling stories using tech and design.

Biplav Srivastava spoke about the need to move toward smart data consumption, for policy decisions and  individual decisions. That the next steps are data integration/re-use/standards, and linked data for analytics.

Shashank Srinivasan shared his experience with open data for conservation (WWF), how they consume OSM data for needs of protecting wildlife. What are risks for crowdsourcing for wildlife conservation?  Open data can be a problem for conservation, control over the end user is needed.

Questions to consider:

How can open data improve our work? How can academia and open data converge? Can donors influence on releasing data? What does it mean to be a digital citizen?

Lightning talks

22904542059_ebbabfda5f_z

Guneet from Akvo shared their smart phone app that detects Fluoride levels in water.


23272573835_0385565697_z
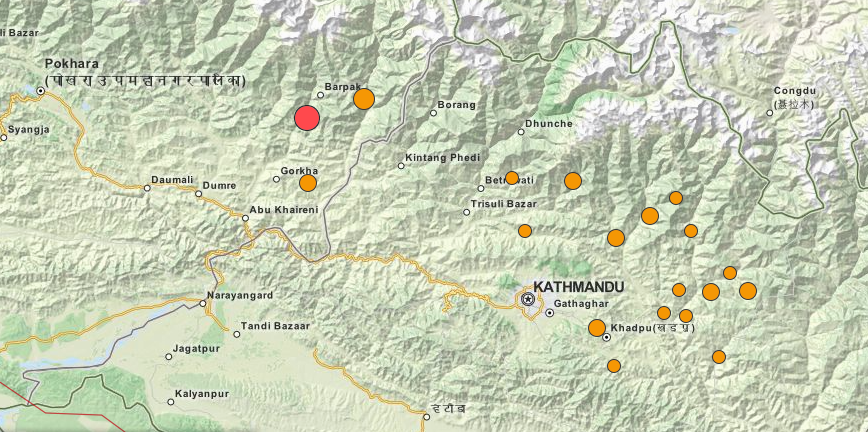
Maning from  HotOSM shared their work around the world providing maps during natural disasters, including the Nepal Earthquake.

23246505476_516b00ee42_z


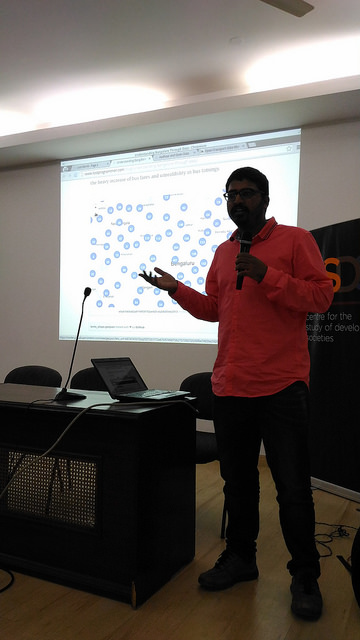
Transport Working Group shared the work looking at bus data in Delhi.


22644205814_d6371e4e92_z

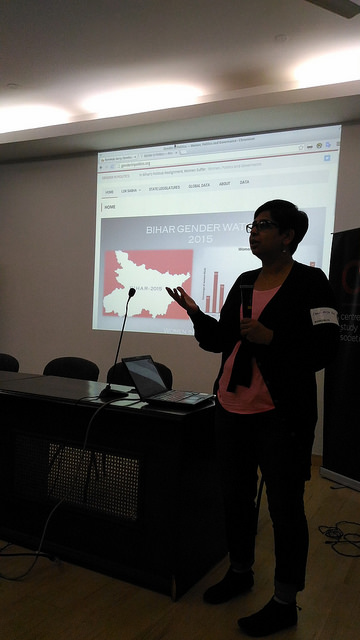
Bihar Gender Watch shared the work of looking at the gender split in elected bodies.


22644166574_0762baa26b_z


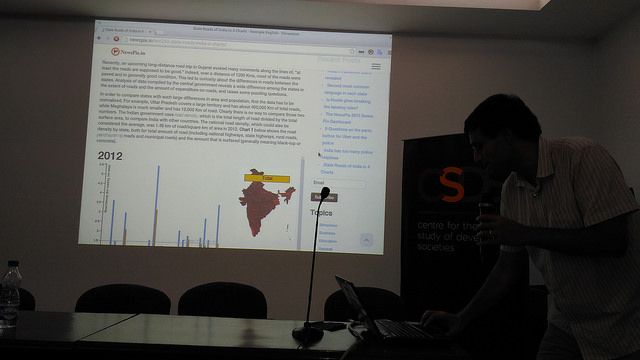
NewsPie is an online news site, they shared the data work they have done in roads and around net neutrality.


23309891061_7dd47539fb_z


Aditya Dipankar shared his work designing information.


23096714180_58a2a19d0b_z
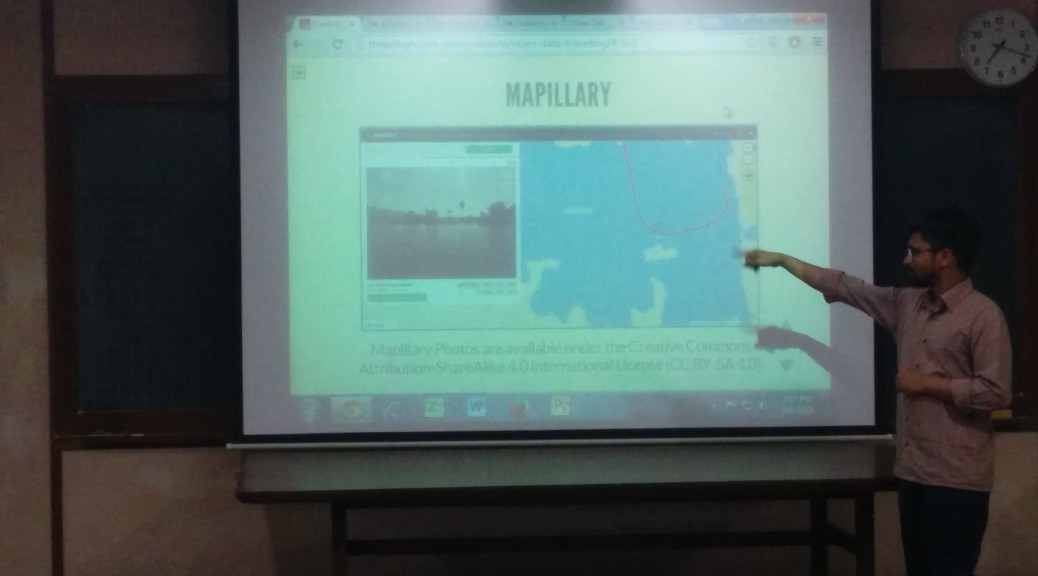
Aruna from MapBox shared their work mapping road naming.


23246355216_623bf9ac92_z


Turam shared his project that built more data collection tools on the Open Data Kit.


23366323936_8626537cba_z


Yogesh from Random Hacks of Kindness  (RHOK) on his vision for an open revolution! Also the work of RHOK in India bridging gaps between organizations on the ground and technologists.


23392480785_b93d014558_z
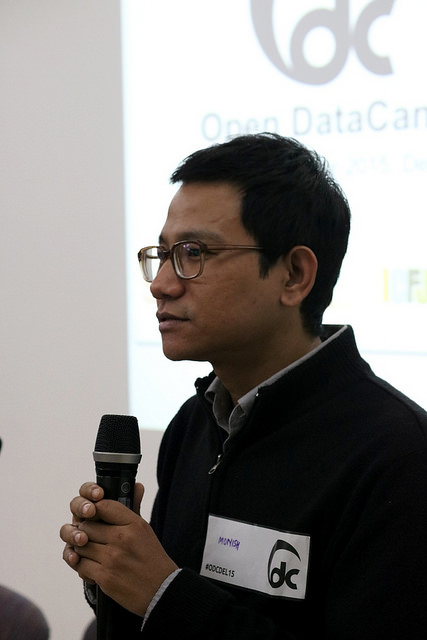
Monish Khetrimayum a PHD student spoke about big data, governance and citizenship.


22765320053_cb6f372d33_z


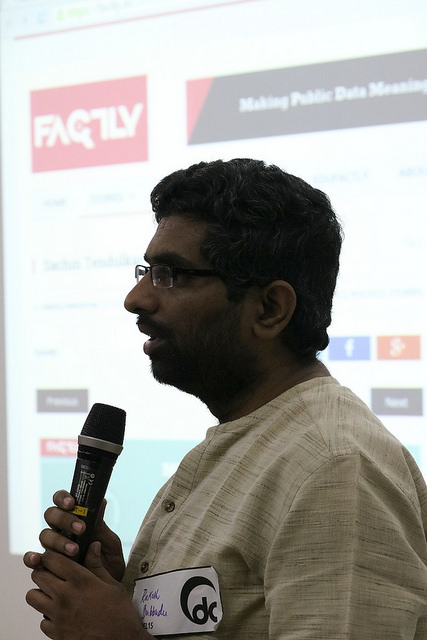
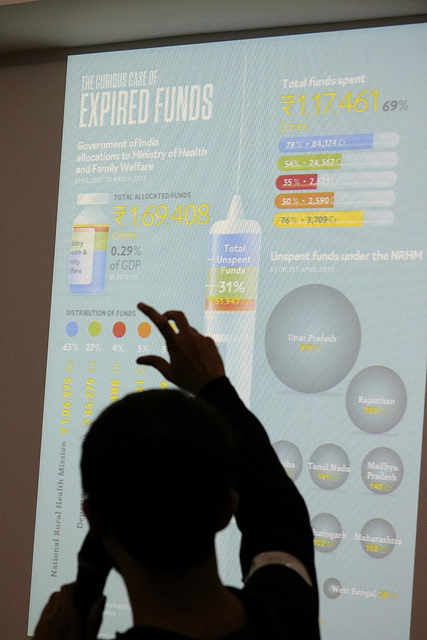
Rakesh from Factly describes how they use RTI information and open data to make sense of information for journalists and citizens.


Group Activity: Response to Digital India

23392506025_19a0dc0b66_m23096736470_c0465ba3d0_m
23024525899_51faa6ca1e_m23284061752_aa07440544_m

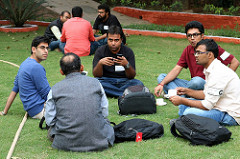
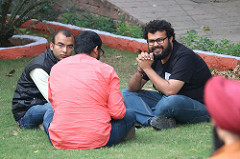
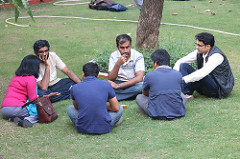
Groups were formed to discuss each pillar and come up with questions.

We have gathered all the questions and put them in the DataMeet hackpad, you can find each pillar here.

Please feel free to take a look and add more questions and dataset requests.

After a week’s time we will be gathering everything and writing a letter of request for openness to Digital India and the various departments, DIETY, to ask them to make this information available.

It was a fantastic day! DataMeet Delhi did an amazing job putting together really interesting speakers to make this a well rounded interactive event.

Thank you especially to the sponsors for helping make this event great!

  • SARAI for the space
  • AKVO for travel
  • ICFJ for food and other support.
  • RHOK for travel

Open Access Week 2015 India Events

It’s Open Access Week! This week there are events around the country to celebrate openness and explore how far we have to go.

MapBox is putting up an amazing Open Data Gallery Tuesday the 20th in Bangalore. Come and hangout look at incredible art and projects from around the country!

In celebration DataMeet is doing its first MULTI CITY EVENT!

Join us Saturday 24th at 6:30pm for talks from Data.Gov.In, Ahmedabad and Bangalore with livestreaming between the cities!

  • Data.Gov.In will talk about the latest updates to Open Data in India.
  • Bangalore will discuss open access in general and open data projects.
  • Ahmedabad will talk about the status of Open Access in their part of the world.
  • Srinivas Kodali will talk about releasing datasets.

Bangalore’s event will be at Centre for Internet and Society.

Ahmedabad will be at CEPT University. 

Please RSVP on Facebook or Meetup.

Let’s celebrate all we have been able to accomplish as a community and look forward to continuing to promote a culture of openness, sharing, learning and collaboration.


The first GeoDel meetup

On the 2nd of September, 2015, DataMeet-Delhi spun off a small side project known as GeoDel. Following GeoBLR‘s example, GeoDel is a Delhi-based group/community that meets to discuss open spatial data in the Indian context.

Akvo very kindly hosted us at their beautiful Delhi office, and we began with a very short talk by me (Shashank) on a quilt my mother made, based on OpenStreetMap data of South Delhi. Riju then spoke about mental maps, using a slideshow with some beautiful maps. He ended his talk with a participatory mapping exercise using FieldPaper maps of Delhi, where everyone who attended the meet had a chance to shout out a random place in Delhi, and everyone else had to mark it on their maps. It was a good way to learn about places in Delhi with arcane names such as ‘Rohini‘ and ‘Patparganj‘, and to end our first GeoDel as well.

GeoDel will have bi-monthly meets, so stay updated on its spatio-temporal coordinates via the MeetUp and FaceBook groups!

Data{Meet} Pune, Second Meetup – Let’s talk Mapping

The 9th of August, 2015 marked 11 years of the OSM project. On the same weekend Datameet Pune fittingly held its second meetup, ‘Let’s talk Mapping’. The session was led by Devdatta (Dev) Tengshe, a veteran of the Bangalore Datameet group who has several years of experience in GIS and remote sensing having worked previously for ISRO. Dev initiated with a primer on what spatial data is and what can be done with spatial data, then followed with an introduction to GIS, a demonstration of OSM and information on sources for spatial data in the Indian context. His presentation can be found here. Below are the highlights of the session.

What is spatial data? Its uses?

Spatial (data) is not necessarily ‘special’ as many say. It is simply data with a spatial element to it, this could be latitude-longitude but pin codes and postal addresses could be used as spatial formats too. There are numerous advantages to viewing/analyzing social sector data spatially, whether it is census data, land records, city water supply/sewerage networks or other datasets. Spatial representation helps detect patterns and trends that may otherwise go unnoticed. Spatial data in the social sector also comes with its set of challenges.  Maps of land parcels for example are not recorded in any standardized way across the country, but instead using local landmarks (turn left at this tree, go straight for 50m, then turn right and head towards the banyan tree) Much of census data is also not easily available at the finer local levels, but only at the district level.

Spatial data can be used to solve spatial problems. Spatial data visualizations work with the strength of the human eye, which is to detect patterns visually. In the exploratory stage you may visualize it to detect patterns, e.g. a map of a user’s Facebook friends may unknowingly reveal areas of low internet penetration, a comparison of Bangalore’s bus routes vs Pune’s bus routes show a stark difference in connectivity. In further analysis you may also find spatial correlations. Spatial modelling is yet another application. These processes are in fact the same ones you would use with regular data, and like all other data, spatial data too requires a lot of cleaning.

IMG_20150808_174421

GIS 101

The real world is infinitely complex. To represent this spatial world in data we have to develop simplified models. These can be either Vector or Raster models. In vector models, we use points, lines and polygons to represent real world features (e.g. bus stops, bus routes, ward boundaries) whereas in raster models we use images of the earth’s surface taken by satellites, or UAVs which are composed of pixels to view the earth’s surface.

File formats for spatial data:

Vector

shapefiles are used within desktop softwares (QGIS, ArcGIS), geojson is used for web mapping (these are light, human and machine readable), kml (first developed by Keyhole, later bought by Google) is also a common format.

Raster

tiff (multiple bands) format allows for storage of larger datasets.

Spatial databases are now able to handle spatial data, allows spatial queries related to it, so a user doesn’t have to write out the logic for such operations (e.g. of spatial queries: Find the nearest school/hospital to this village?). Spatial databases are used by retail businesses, housing, utilities and many other commercial ventures.

Where do I get spatial data?

The Beg-Borrow-Steal theory

Beg

Create it yourself. In the process of field work you can use field kits to collect spatial data for your area of interest. Tools available for this include Locus map free – Outdoor GPS (App) OR Open Data Kit (Software suite). As an alternative, you may also digitize from satellite maps

Borrow and convert it

Data that may be available freely but not in a form that is easily usable and may need to be georeferenced.

“Steal”

Spatial data can be ‘scraped’ from websites that contain this data but do not make it easily available, see github datameet maps for examples of data collected from census websites. Although permission may not explicitly be given for this, since it is already up on the web and no copyright exists on the data it is implicitly understood to be open source.

Open Street Map (OSM)

The Wikipedia for spatial data, OSM, counts more than two million users who voluntarily contribute to the project. OSM was first aimed to collect just street data, but it has now expanded tremendously. City data in OSM is of high quality however for rural areas, only major roads can be guaranteed.

Unlike Google maps which does not allow a user direct access to its data, OSM raw data is available for download as well as editing. Within OSM users can tag different aspects of any object, giving others more information about it. Users can also introduce new key:value pairs if needed. OSM scripts monitor changes and an IRC chat room verifies these changes. OSM updates frequently and is therefore used in humanitarian situations (HOT OSM). Only 12 servers run all of OSM

IMG_20150808_173926

Wikimapia in comparison is limited, it allows you to draw on google maps, but there is no verification of additions and limited data download.

There are independent initiatives to make available raw data download from OSM [See slide 47] Similarly other apps use and make available OSM data, Map quest for instance gives directions based on OSM data. If you are unsure of the final use of your data you can download data in OSM XML format, since it contains everything. GeoJSON is useful only when you need shapes, not other features of spatial data.

Sources

  • Downloading OSM data for a country: Geofabrik
  • Downloading OSM data for any custom polygon: BBBike
  • Raw data based on particular data queries: Overpass Turbo

Spatial data in the Indian context

Districts/Tehsils

Shapefiles for districts and tehsils are available on Github, Datameet maps. However maps must be verified against other sources of data. In reality there is dispute even within the Indian government on how many districts India has.

Village boundaries

In reality, in many cases no fixed village boundaries exist, the Census uses blocks and settlements for reference. Some states however make available static maps showing village boundaries that can be georeferenced.

Pin codes

Can we divide the country into pin codes? Pin codes do not represent an area, they are points along a line where the postman will deliver. Hence the assignment of addresses to the last  three digits of a pin code is a decentralized decision. The lowest level of post offices decides. Pin codes also do not cover the entire country. Post offices to Pin codes do not have a one-to-one relation.

Census data

Census data at the finest spatial level comes down to census ward boundaries. Nobody outside the census department actually knows these boundaries. Pune city has 700 census ward boundaries (which do not correspond to administrative/electoral ward boundaries) mostly hand drawn. District level offices may have maps with these boundaries as hard copies.

Nothing in national policy disallows them from sharing them, but nevertheless government officials aren’t inclined to share such information. Certain limitations however do exist on government data sharing, protected military areas, areas near the national boundaries, topography maps etc. are prohibited.

Basemaps and DEMs (Digital Elevation Models)

The Open data initiative of the Government of India has created some 5400 odd ‘Open Series maps’ i.e. toposheets without height information. None of these are done digitally or printed. They can however be used with gps data since the lat-long is accurate.

Since GoI topography data isn’t made openly available, alternatives available are SRTM, ESTER and Bhuvan Cartosat. These are good for example for larger rural areas, but not feasible for urban areas. Private companies work with UAVs for very high resolution elevation data. For satellite imagery as basemaps, Landsat imagery, going back to 1970 is available.

Closing Remarks

In following up with our discussions on mapping, for those of you who are interested, we have several Pune specific mapping tasks that individuals can contribute to. E-mail us at pune@datameet.org for more information. We hope that everyone found the discussion useful and thank you for coming, thanks to Dev for the informative session! Thanks to Shraddha and Thoughtworks Pune for hosting us. Do connect with us via social media [Twitter] or join our mailing list for information on the next meeting.

{Ahmedabad} – 3rd Meetup

This meetup was special as this was on my way back from the long drive. Since I was doing quite a bit of Open Data work on my trip, I thought I would talk about the same. So we had a long conversation about how we can contribute while on a long drive.

IMG_20150705_191653

The presentation is embedded below or you can check the presentation.

We discussed in detail about the following services to which any one can contribute

We also discussed about the Apps for Android that can be used to collect and submit data.

Latlong’s story of mapping India

The July edition of GeoBLR featured Rahul RS from Onze Technologies. Onze is the prefered store locator infrastructure by several businesses in India including TVS, Dell and Cafe Coffee Day. The store locator is powered by Onze’s very own Latlong.in – extensive, web based points of interest and map data interface.

2015-07-30 18.23.40

Rahul shared the story of Latlong.in, their infrastructure and challenges mapping Indian cities. They started out in 2007 at a time when there was no reasonable geographic data source available for India – commercial and non-commercial. Rahul’s team gathered toposheets from the Survey of India and georeferenced boundaries to incorporate into their maps. Rahul pointed out that these are inexpensive but high effort tasks. Plus, tools to do these are expensive.

In order to address India-specific mapping needs, geo-rectification needed to be inevitably supported by field surveys. Each city is unique and people entirely depend on landmarks and hyperlocal information to get around. Rahul brought in experts from different areas to gather local information. “The idea behind Latlong.in starts by saying that addresses don’t work in India”, says Rahul. When OpenStreetMap picked up, Latlong.in moved to a mix of their data and OSM that was maintained on their own. It is a complicated effort. Conflation and dealing with multiple revisions of data is tricky and there aren’t great tools to deal with it effortlessly. Latlong.in follows Survey of India’s National Map Policy. They avoid mapping defence and high security features.

Owning the entire data experience is critical to win in this market. Remaining open and improving continuously is the only way to keep your datasets upto date.

Data{Meet} Pune – First Meetup

Datameet Pune, hosted its first meetup last Monday, the 13th of July at Thoughtworks, Pune. The idea of DataMeet which originated in Bangalore as a community of data enthusiasts, working on civic issues has now spread to several cities across the country, Pune being the latest.

Datameet Pune - First Meetup (1)

Twenty-six people of diverse backgrounds, both from the programming world (students and professionals) as well as those conversant with social sector issues (NGOs and citizens) attended the meeting (including 3 via Google Hangout). A icebreaker and a game of Pune related trivia got the meeting off to a start. Participants introduced themselves and their broad areas of interest. Ideas revolved around public transport, voter registration, land use change, water and sanitation, waste management, education, mapping, data visualization and more. The organizers then gave a brief presentation on the idea of DataMeet, examples of data successes in the social sector elsewhere and the possible scope of projects that can be explored within the Pune group. Nikhil welcomed those interested to pitch in on some of his projects related to Pune’s bus routes management system and Pune’s budget sheet.

Datameet Pune - First Meetup (2)

The floor was then open to the participants to QnA and ideas. Participants discussed the format of further engagement within the group. They agreed that it would be best to start off with monthly meetings organized around topics (related to data and civic issues) where a speaker could initiate discussion based on his/her experience. Topics suggested were mapping, basic statistics, R/Python, better data analysis with Excel, etc. Dev, Vinayak and Rasagy originally from the Bangalore DataMeet agreed to initiate discussions on possible topics. Rahul, urged that the topics taken up by speakers should have a practical orientation rather than being more theoretical, since seeing practical applications tends to interest people more. Sanskriti also suggested sector specific meetups for example on transport, since the Pune public transport service (PMPML) is launching a new BRT route. Participants were briefed about hackathons and Open Data Camps (ODCs) which have happened in other cities and it was suggested that Pune could explore these formats as well.

The forum for online engagement of the Pune group, suggested by Vinayak, was Slack.com, to which everyone was agreeable. (a Slack channel was later setup for the Pune group on the main Datameet Slack). For in-person meetings, everyone agreed to meeting once a month, and Saturday was the day agreeable to most, early evening or morning were suggested as possible timings. Additional venues, including CEE, Drive Change, Flame University and Indradhanushya were also suggested. A meetup page was setup by Anurag, for updates about future meetups.

Participants were also strongly urged to fill out the DataMeet Pune Interest Form to hear about future activities, available here. The meeting was overall a great success,the participants showing a lot of enthusiasm for actively collaborating together. Please stay tuned for announcements of future meetings. In the meanwhile you can find the Google Hangout recording of the meeting here. For Pune specific queries please email pune@datameet.org or contact Craig/Nikhil.

Craig D: 7276085960, craigds022@gmail.com or Nikhil VJ: 9665831250, nikhil.js@gmail.com

Mumbai Meet 6: Data Science Hackathon

DataMeet 6 was a 2 day, Data Science Hackathon that was organised by a BFSI company, Zone Startups and DataMeet Mumbai. The Hackathon took place in the Bombay Stock Exchange Building at Zone Startup’s office. Twelve teams participated. These included teams of young data enthusiasts and specialist data scientists teams from companies like TCS and Housing.com.

The BFSI company opened up 80GB of it’s real transactional data in a secure environment to the participating data enthusiasts.

The teams were expected to analyze the data and draw out insights that would be relevant to their use case scenarios such as Health Bankruptcy or pull out a trend which is hidden and unknown to the BFSI company. Teams were free to use any tool of their choice from R, Python, Tableau, etc.

Each team was provided an individual secure Oracle DB connection from which they could query the data but not download the data. The Oracle DB connections were opened only to the Static IPs of Zone Startups Office and the data to and fro from the servers was monitored to ensure against downloading of the data.

Day 1

The day started with various teams analysing the raw data, tables, meaning of columns. The representatives from the BFSI company also gave a briefing about objectives.

600_437353359

Day 2

Many of the young teams did not turn up on Day 2 due to complexity of the problem. At the end of Day 2, the judges from the BFSI company evaluated each team’s progress, gave feedback and suggestions.

600_437353364

{Ahmedabad} – 2nd Meetup

Data{Meet} Ahmedabad – 2nd Meetup

Data{Meet} Ahmedabad - 2nd Meeting

Data{Meet} Ahmedabad – 2nd Meeting

Our 2nd meetup was held at IIM-A, under the aegis of the RTE Resource Centre, with 20 participants; half of them had attended the 1st meetup.

Talk #1: All walls come down – by Ashish Ranjan, RTE Resource Centre, IIM-A

The first talk in the 2nd DataMeet of Ahmedabad Chapter brought forward the efforts being put together by the team RTE, working out of IIM-Ahmedabad. The team members present at the venue were Prof. Ankur Sarin, Ashish Ranjan, Advaita R and Nishank Varshney. Ashish presented their journey of supporting the implementation of RTE in the state of Gujarat.

The Right to Education (RTE) act Section 12 requires schools to enrol a certain number of children from economically weaker families. The RTE Resource Centre (rterc.in) organises pre-enrolment campaigns for the benefit of prospective students and their parents, and has enlisted NGOs for hand-holding the children post-enrolment. The talk gave a glimpse of their experience in Ahmedabad, observations from Maharashtra, and the data-related challenges they faced.

datameet2

The management of this important activity was being done manually. This threw up many problems:
The registration of beneficiary families was often incomplete, with partial addresses – recording just the area of residence e.g. “Jamalpur”. This lead to many parents complaining about non-receipt of allotment letters..
There was no mapping of schools or beneficiary families, which could have aided better matching of children and schools.

A study by the team RTE revealed how a large number of schools were finding their way around the RTE mandate. These methods include making demands of un-required documentation of the parents to, tricking the MIS systems which enable applications from parents, into counting the ages of the children eligible for the schools as ineligible amongst various others. Nishank pitched in with instances from Maharashtra, where the minimum and maximum permissible age limits were deliberately entered by schools in such a way that potential students would be under age during an admission year, and over age the next year, effectively excluding them. In some particularly bad cases, the difference was one day: the child would have to be born on a specific date. For lack of efficient and transparent allotment processes, there were cases of candidates getting multiple admissions (as much as 18) while some did not get any. To bring out all these analyses, though, the school and student data from the Maharashtra RTE website had to be painstakingly downloaded, manually. Many DMers offered support to gather this data more easily.

datameet3

The team was quite inspired by the school map of the Karnataka Learning Partnership (klp.org.in/map) and wants to build such a comprehensive tool for themselves, with features to find schools within a specified distance, and help match students with schools. Unlike the Karnataka programme, there still is no MIS in place to facilitate the enrolment and selection process. Shravan suggested that it might be possible to use the codebase of KLP and adapt it for use in Ahmedabad. Hopefully, the D{M} folks will volunteer for the necessary support.

The RTE team also wants to build a tool to track the performance of enrolled students. They discussed about the potential privacy issues involved in this. It was suggested that the performance reporting to be published on the website could be at an appropriate level of aggregation which safeguards privacy and preserves discernible performance stats. The possibility of using ODK for volunteer led data collection was also discussed.
Getting together at the meetup opened up many possibilities for collaboration from the participants as a few of them came forward with suggestions and also extended their support to this cause.

Talk #2: Public Transport of Ahmedabad

Jayesh Gohel is not your everyday architect. He dropped out of his course at CEPT because he got too interested in code and soon enough he started enjoying making websites. Being an Amdavadi, he noticed the lack of infrastructure, both digital and non-digital in supporting the commuting that AMTS enabled in the city and so he decided to work on amtsinfo.in – the unofficial official support and information website for the Ahmedabad Municipal Transport Service.

Jaye

At the 2nd Datameet in Ahmedabad, Jayesh inspired the audience with his experiences with developing the website with the sole aim of solving the information problem related to the rather important and convenient network that AMTS is. Jayesh’s talk was simple and spoke about his personal motivations and learnings in the course of the development of this app. It also brought to the light the issues that plague the archaic systems that govern our modern lives, which can otherwise be so easily solved with the use of digital technology. However, ‘there’s hope if all of us take initiatives’, Jayesh said.

Nepal Needs You to Make Maps!

Post by Tejas AP

The Humanitarian OpenStreetMap Team (HOTOSM) has activated to support crisis response in Nepal after the recent devastating earthquake. A global team of volunteers is contributing to the OSM project by mapping physical infrastructure (roads and buildings) as well as traces and areas safe for crisis responders to use and congregate at. We believe improved information, especially of the remote affected areas, is crucial to improve the efforts carried out by relief agencies on-ground.

Volunteers may contribute to the map of Nepal simply by selecting a task from the wiki. Basic questions about registering and using the OSM mapping tool can be found in its comprehensive documentation here.

While the volunteers have been recording road networks and buildings at a rapid pace, we understand that the communication networks in Nepal are still being restored, and crisis responders might not have access to navigation maps to expedite their efforts. We want to help in ensuring that people have access to map data in every manner possible.

We want to print offline maps and send them with relief materials from India to Nepal. Please help us by providing us

* a list of towns/villages/regions you need maps of, and

* point-of-contact we can deliver the printed maps to.

For more information, please get in touch with

Sajjad  – sajjad(at)mapbox(dot)com

Tejas  – tejaspande(at)live(dot)com

Nisha  – nisha(at)datameet(dot)com

Prabhas – prabhas.pokharel(at)gmail(dot)com

Meanwhile, here’s some information that you might find useful  –

1. https://www.mapbox.com/blog/nepal-earthquake/
2. The News Minute report –
http://www.thenewsminute.com/article/how-group-individuals-all-over-india-are-making-maps-help-rescue-teams-nepal
3. HOT Wiki – https://wiki.openstreetmap.org/wiki/2015_Nepal_earthquake
4. KLL report – http://kathmandulivinglabs.org/blog/